sp 500 looks toppish below 21702180 677012015
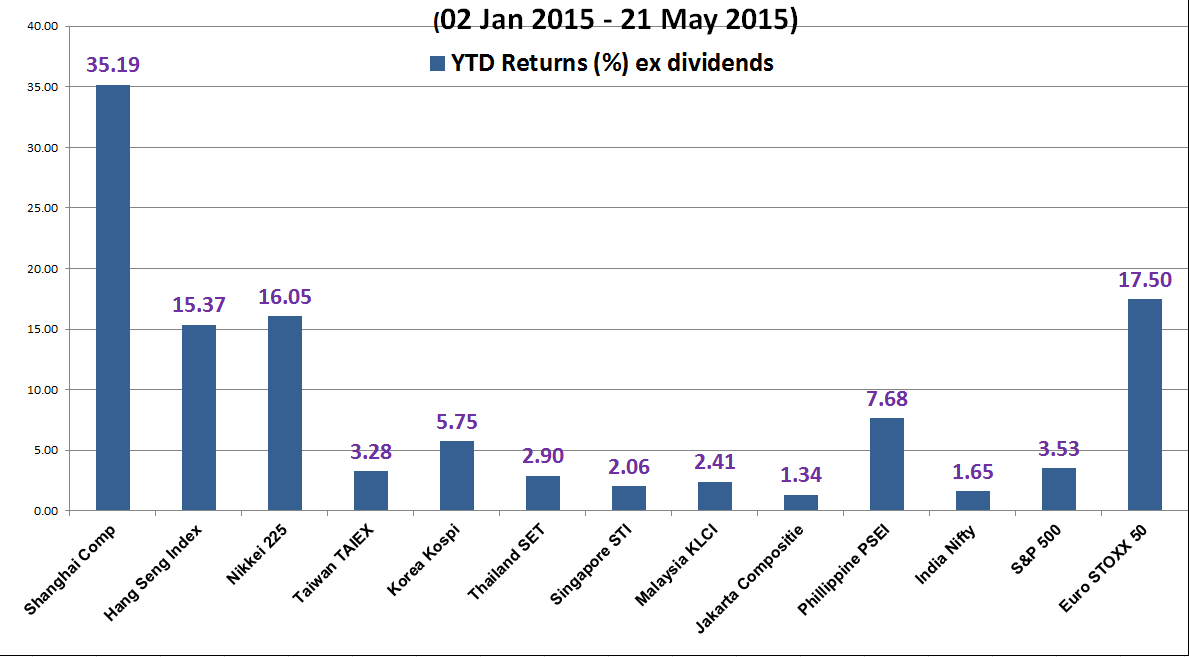
As seen from the year-to-date performance (ending 21 May 2015) of the major and Asian stock indices, the S&P 500 has recorded a lacklustre performance of 3.53%. This dismal performance of S&P 500 is way below its counterparts such as the Euro STOXX 50 (+17.50%), Nikkei 225 (+16.05%) and Shanghai Composite (+35.19%) despite its improving economic conditions versus Europe, Japan and China.
Let’s dissect the S&P 500 from a technical analysis perspective to gauge its future expected performance.
Key elements
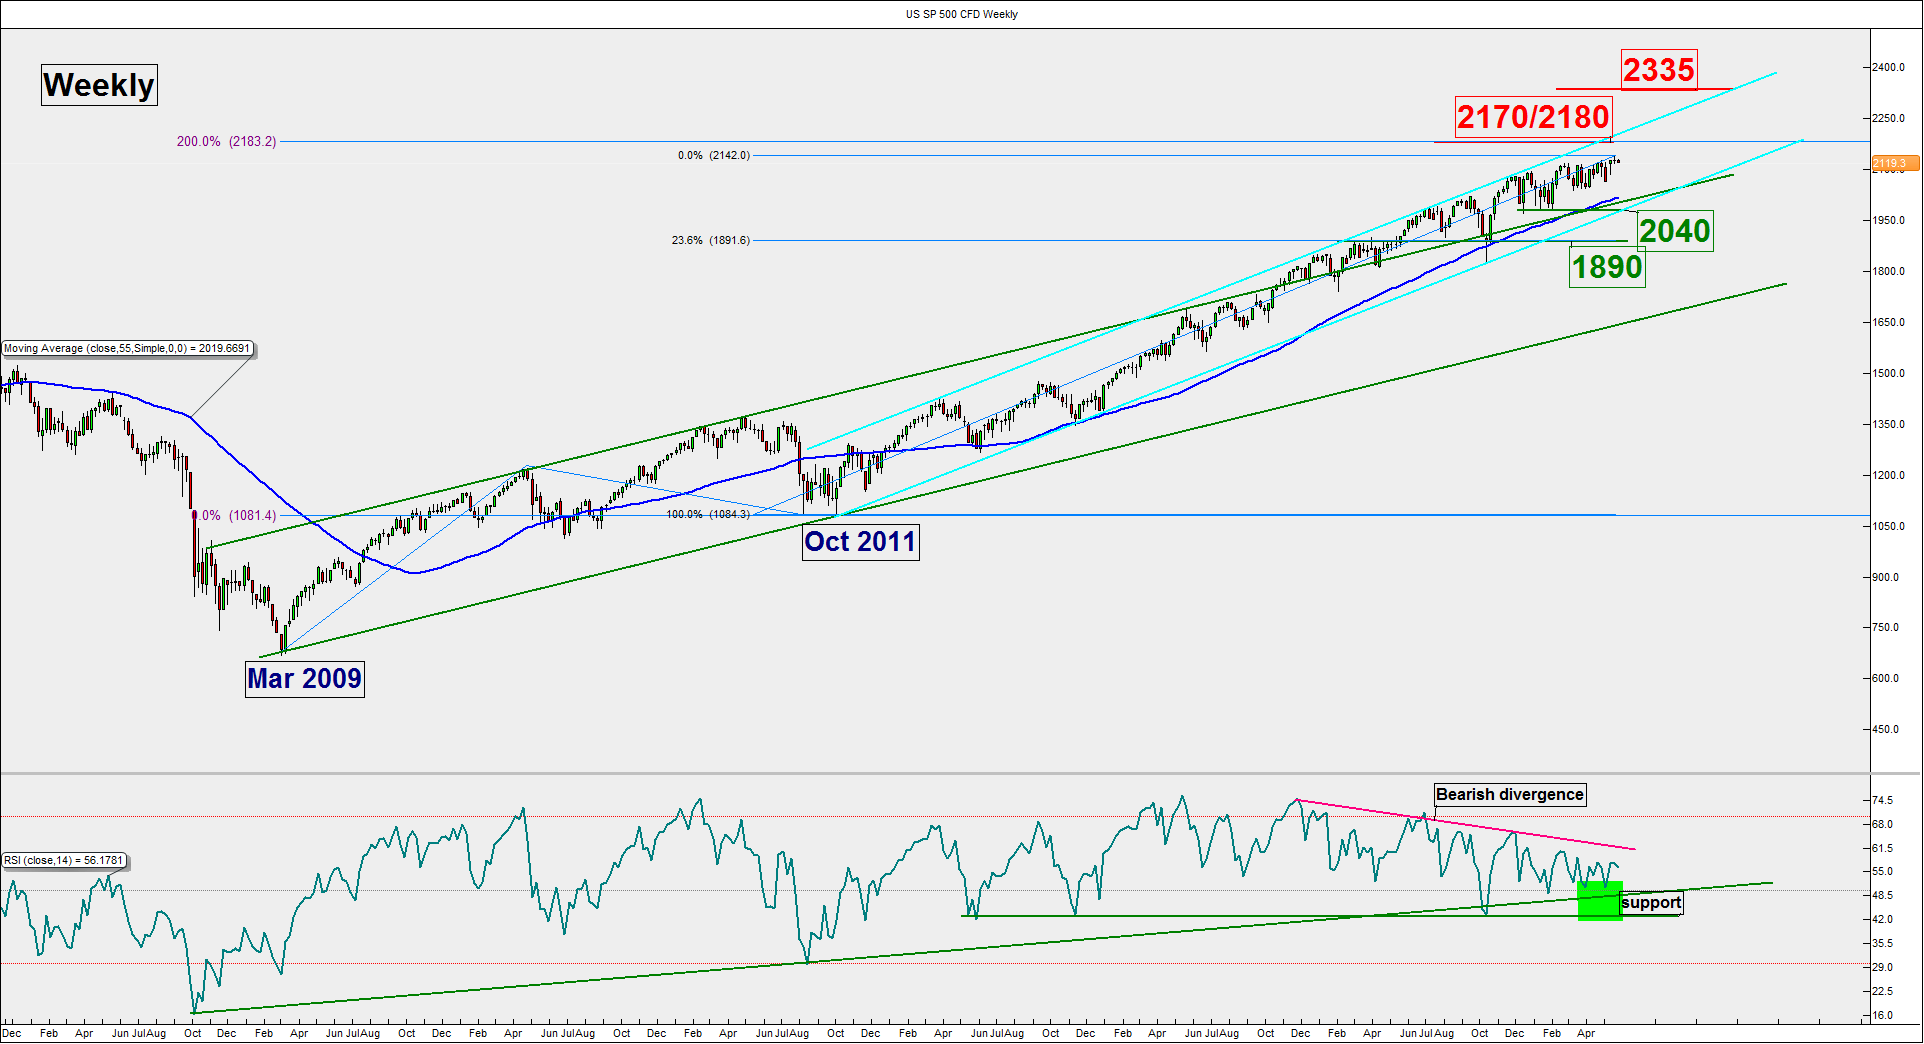
- The S&P 500 is now trading close to the upper boundary (resistance) of its long term ascending channel (in light blue) in place since 02 October 2011 low at 2170/2180.
- The 2170/2180 resistance is a significant zone as it confluences with multiple Fibonacci projection clusters (see weekly & daily charts).
- The long term RSI oscillator continues to flash a bearish divergence signal since late December 2013 which indicates weakness in upside momentum in price action of the Index (see weekly chart above).
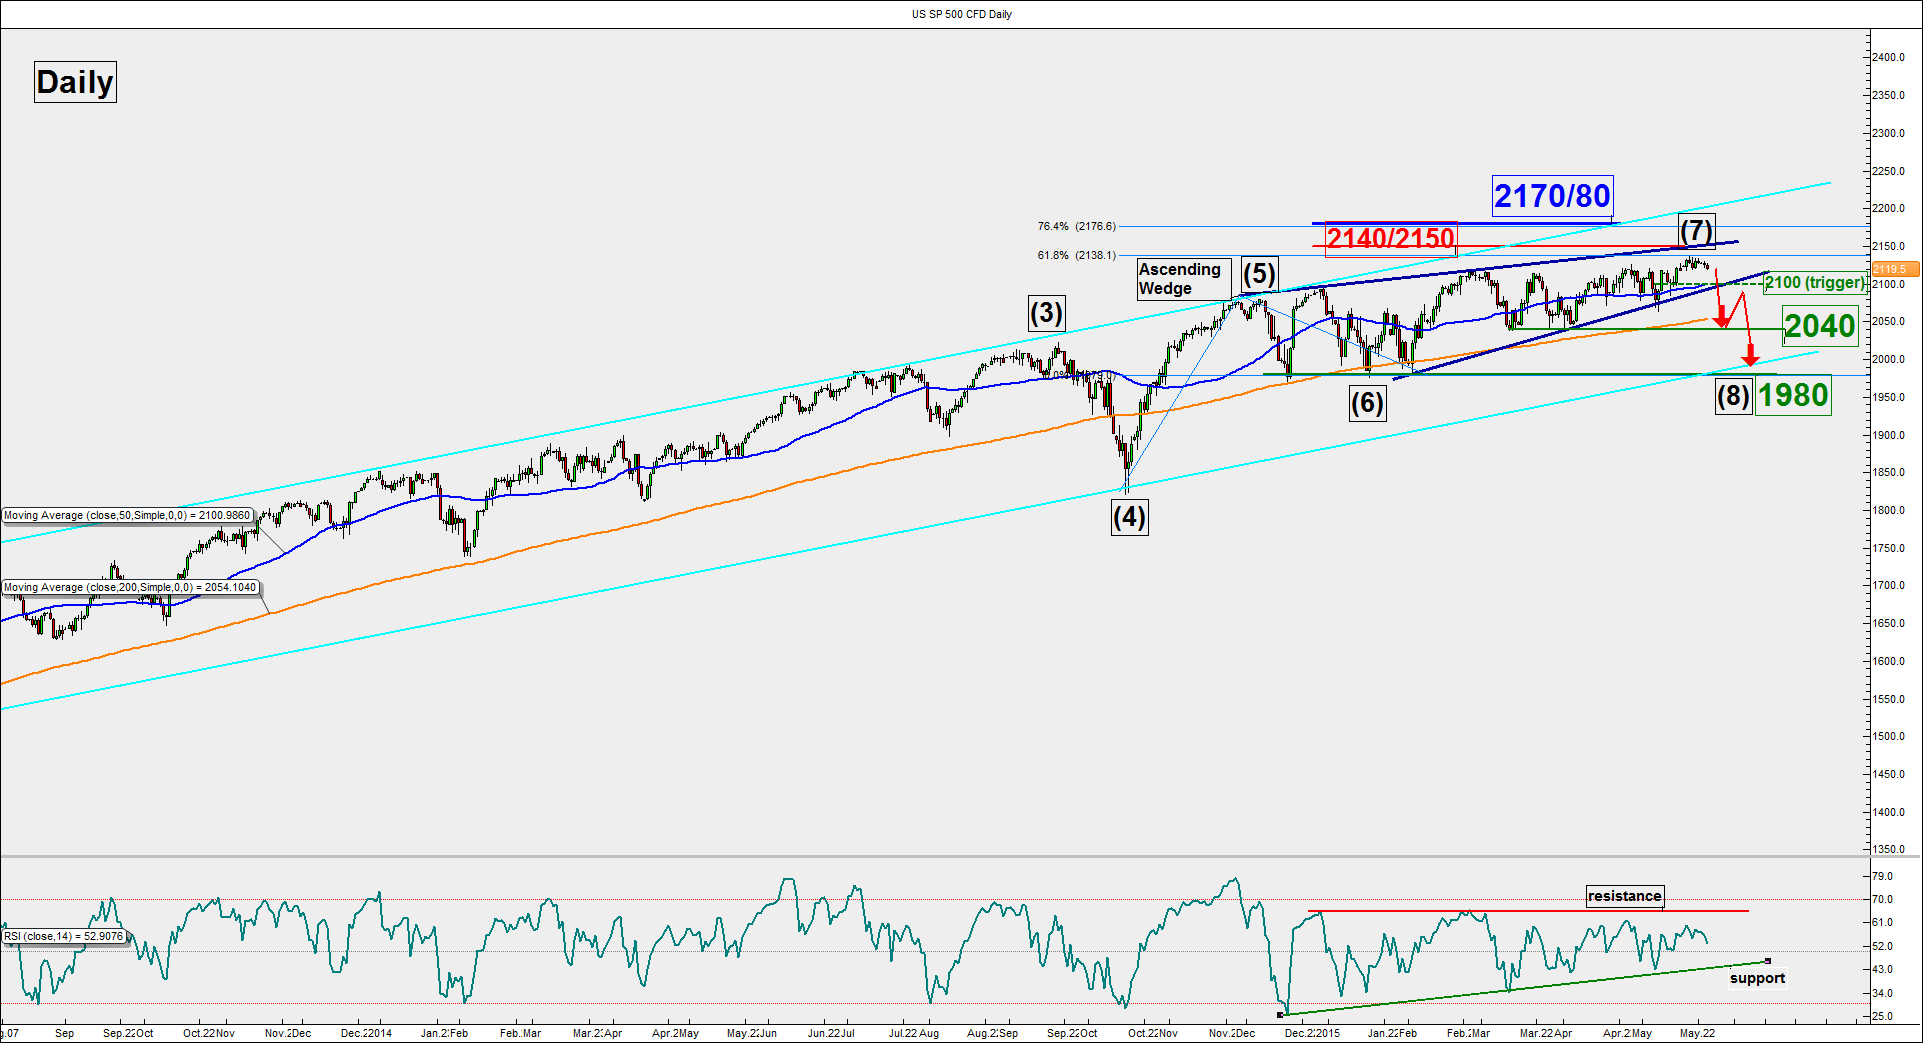
- Another weakness can been seen in the recent price action since late December 2014 as the Index has traced out an impending bearish “Ascending Wedge” configuration (in dark blue) with its upper boundary (resistance) at 2140/2150 (see daily chart above).
- The lower boundary (support) of the “Ascending Wedge” configuration stands at 2100 (see daily chart above).
- The significant supports are at 2040 which is the 200-day Moving Average (in orange) follow by the lower boundary of the long-term ascending channel (in light blue) at 1980 (see daily chart above).
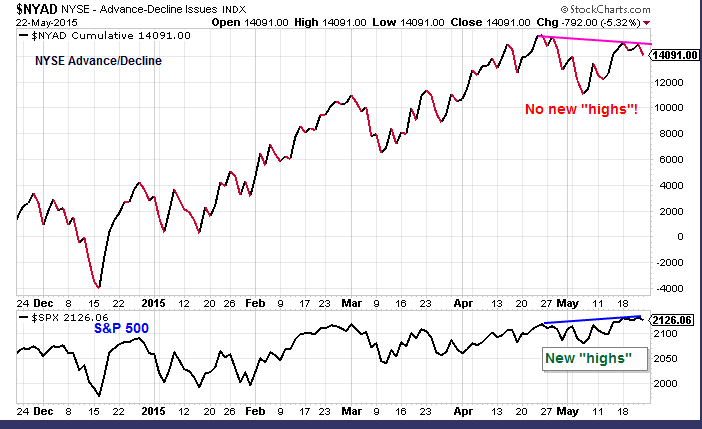
- Market breadth has started to deteriorate since 24 April 2015 as the NYSE cumulative Advance/Decline line has traced out a lower “high” despite a higher “high” seen in the S&P 500.
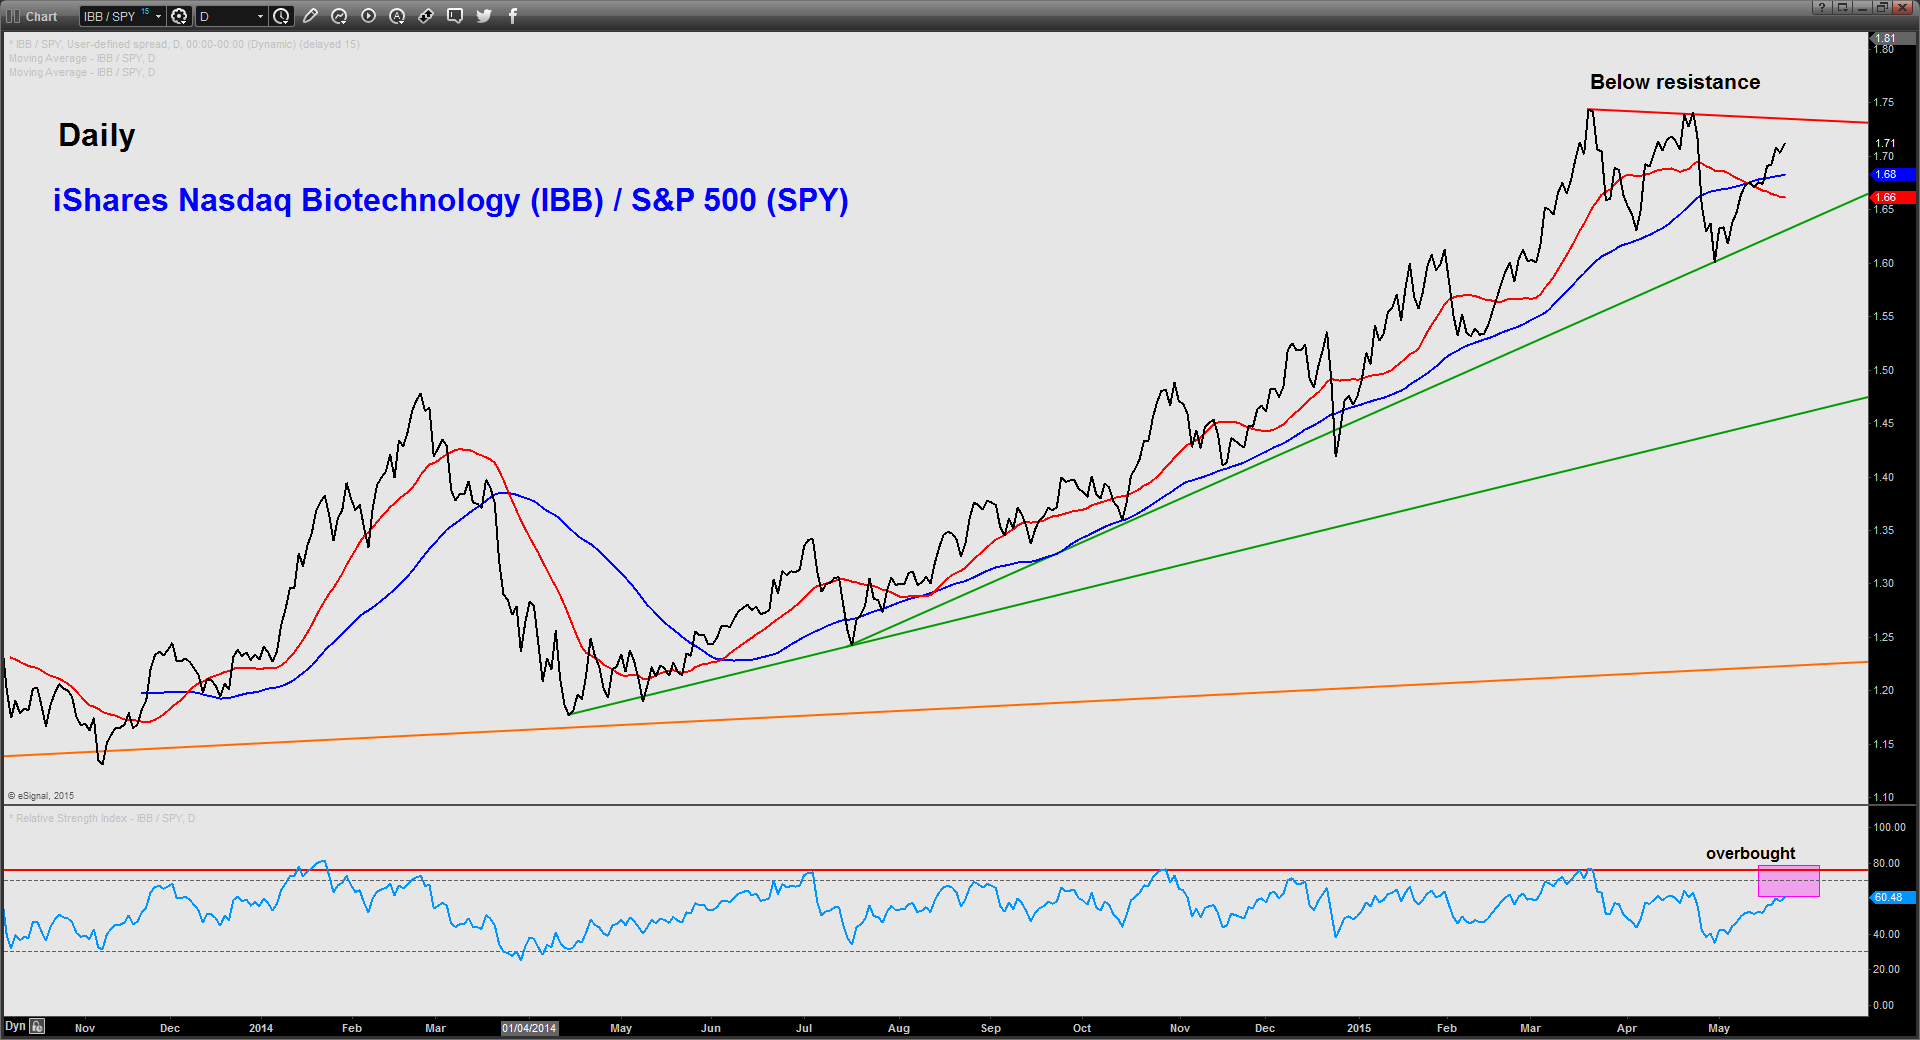
- The Biotechnology sector which is considered as a sector leader due to its superb performance seen last year (+39%) has started to underperform against the S&P 500. Its relative strength chart by taking the respective ETFs (exchange traded funds) of the Biotechnology sector (IBB) against the S&P 500 (SPY) is being capped by a graphical resistance. In addition, the RSI oscillator is coming close to its overbought region. This weakness seen in a sector leader warrants caution on the broader market.
Key levels (1 to 3 months)
Intermediate resistance: 2140/2150
Pivot (key resistance): 2170/2180
Support: 2100, 2040 & 1980
Next resistance: 2335
Conclusion
The S&P 500 (US SP 500) is coming close to a key inflection level of 2140/2150 with deteriorating technical elements. As long as the 2170/2180 pivotal resistance is not surpassed, the Index faces the risk of a significant “min correction” of 5% to 6%. A break below 2100 is likely to add impetus for this potential steep decline towards 2040 before 1980. Do note that the long-term bullish trend is still intact (see monthly chart above).
On the other hand, a clearance above 2180 is likely to invalidate the bearish view to open up scope for a multi-month upside movement to target the next resistance at 2335.
This report is intended for general circulation only. It should not be construed as a recommendation, or an offer (or solicitation of an offer) to buy or sell any financial products. The information provided does not take into account your specific investment objectives, financial situation or particular needs. Before you act on any recommendation that may be contained in this report, independent advice ought to be sought from a financial adviser regarding the suitability of the investment product, taking into account your specific investment objectives, financial situation or particular needs.
StoneX Financial Pte. Ltd., may distribute reports produced by its respective foreign entities or affiliates within the StoneX group of companies or third parties pursuant to an arrangement under Regulation 32C of the Financial Advisers Regulations. Where the report is distributed to a person in Singapore who is not an accredited investor, expert investor or an institutional investor (as defined in the Securities Futures Act), StoneX Financial Pte. Ltd. accepts legal responsibility to such persons for the contents of the report only to the extent required by law. Singapore recipients should contact StoneX Financial Pte. Ltd. at 6826 9988 for matters arising from, or in connection with the report.
In the case of all other recipients of this report, to the extent permitted by applicable laws and regulations neither StoneX Financial Pte. Ltd. nor its associated companies will be responsible or liable for any loss or damage incurred arising out of, or in connection with, any use of the information contained in this report and all such liability is hereby expressly disclaimed. No representation or warranty is made, express or implied, that the content of this report is complete or accurate.
StoneX Financial Pte. Ltd. is not under any obligation to update this report.
Trading CFDs and FX on margin carries a high level of risk that may not be suitable for some investors. Consider your investment objectives, level of experience, financial resources, risk appetite and other relevant circumstances carefully. The possibility exists that you could lose some or all of your investments, including your initial deposits. If in doubt, please seek independent expert advice. Visit www.cityindex.com/en-sg/terms-and-policies for the complete Risk Disclosure Statement.
ALL TRADING INVOLVES RISKS. LOSSES CAN EXCEED DEPOSITS.
City Index is a trading name of StoneX Financial Pte. Ltd. (“SFP”) for the offering of dealing services in Contracts for Differences (“CFD”). SFP holds a Capital Markets Services Licence issued by the Monetary Authority of Singapore for Dealing in Exchange-Traded Derivatives Contracts, Over-the-Counter Derivatives Contracts, and Spot Foreign Exchange Contracts for the Purposes of Leveraged Foreign Exchange Trading. SFP is also both Derivatives Trading and Clearing member of the Singapore Exchange (“SGX”). SFP is a wholly-owned subsidiary of StoneX Group Inc.
The information provided herein is intended for general circulation. It does not take into account the specific investment objectives, financial situation or particular needs of any particular person. You should take into account your specific investment objectives, financial situation or particular needs before making a commitment to invest, including seeking advice from an independent financial adviser regarding the suitability of the investment, under a separate engagement, as you deem fit. No representation or warranty is given as to the accuracy or completeness of this information. Consequently, any person acting on it does so entirely at their own risk.
The information does not represent an offer of, or solicitation for, a transaction in any investment product. Any views and opinions expressed may be changed without an update. To understand the risks and costs involved, please visit the section captioned “Important Information” and the “Risk Disclosure Statement”.
The information herein is not directed to, or intended for distribution to or use by, any person or entity who is a citizen or resident of or located in any locality, state, country or other jurisdiction where such distribution, publication, availability or use would be contrary to law or regulation.
StoneX Financial Pte. Ltd. 1 Raffles Place, #18-61, One Raffles Place Tower 2, Singapore 048616. Tel: 6309 1000. Co. Reg. No.: 201130598R.
This advertisement has not been reviewed by the Monetary Authority of Singapore.
© City Index 2024