Nasdaq bounce shoves aside value comeback
What goes around….often just keeps going: ‘value’ bounce may be fading already
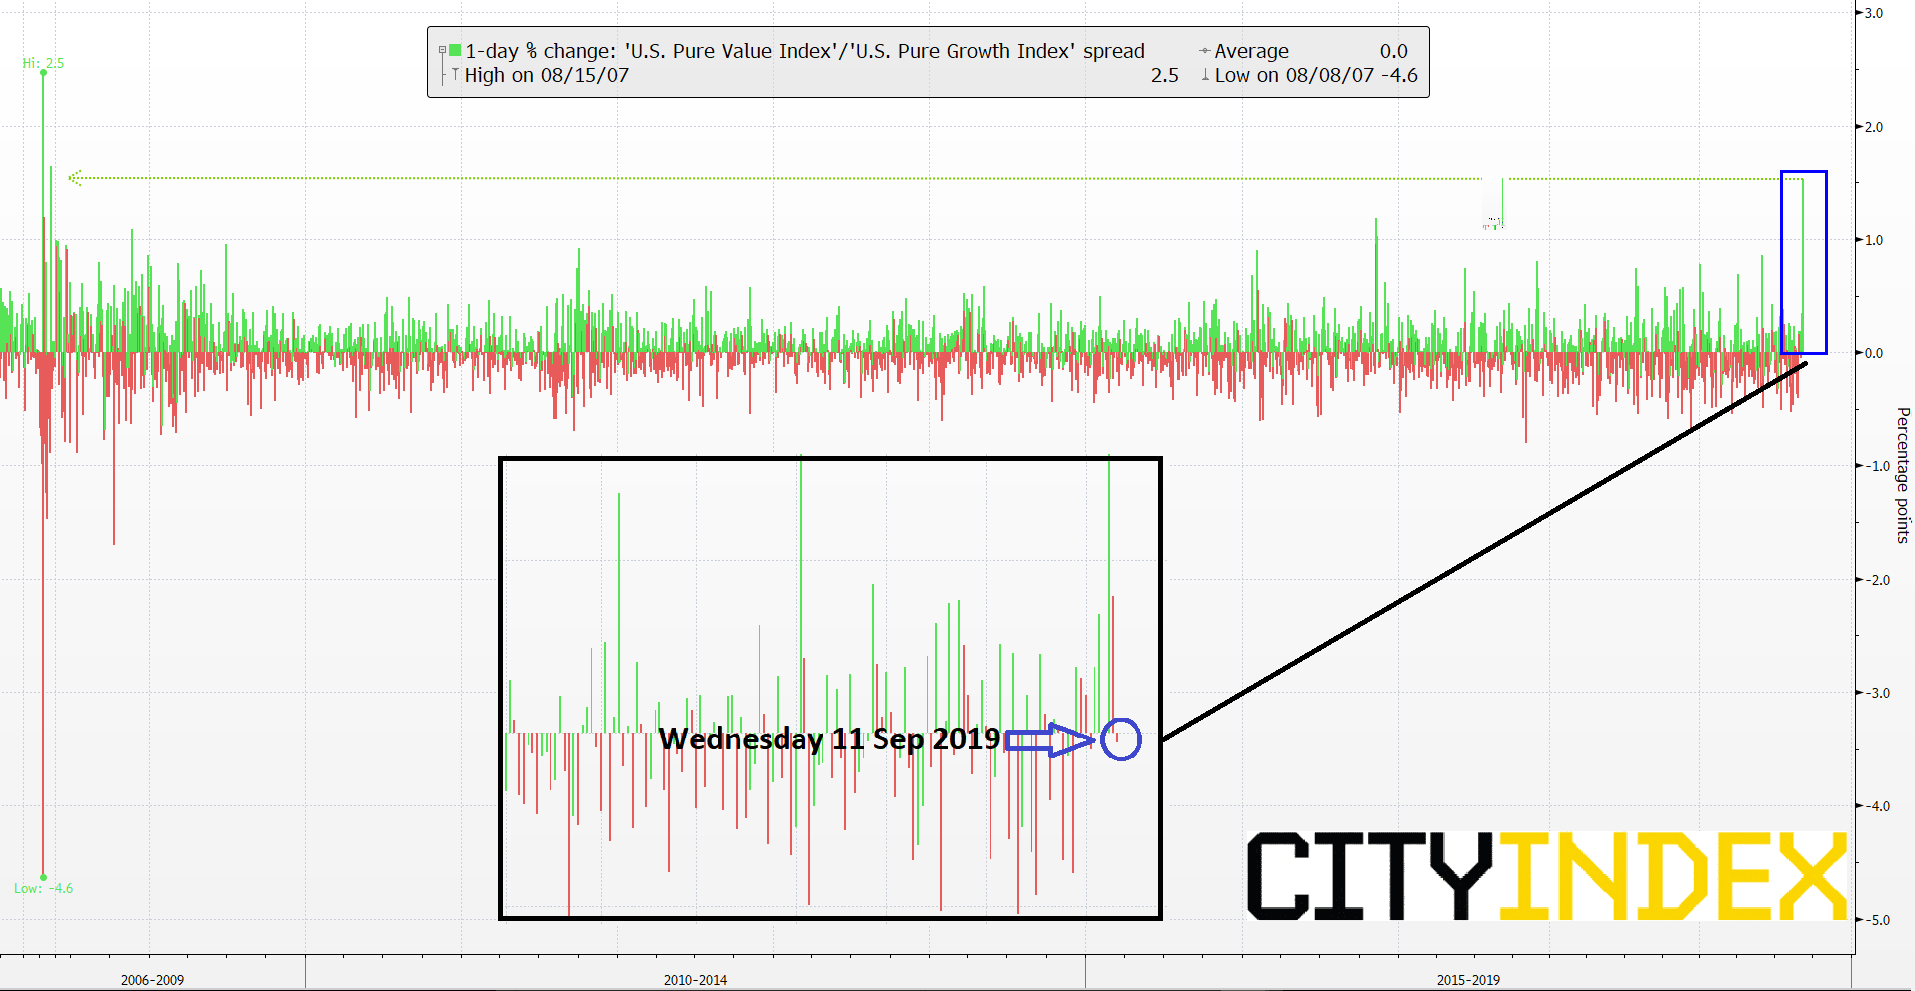
Indications so far from Wednesday’s U.S. stock trading session suggest that the move to favour cheaper, higher-yielding shares over long-standing 'momentum' outperformers, may be fizzling out already. Despite lacklustre sessions earlier this week, which saw the S&P 500 index close flat on Monday, Wall Street has been awash with talk over a sharp swing—known as a ‘rotation’—away from one set of equity market sector preferences in favour of another. The move back to ‘value’ shares from ‘momentum’ stocks was the fiercest over one trading day, according to data gathered by Bloomberg. The chart below shows daily percentage changes of the spread between Bloomberg’s ‘U.S Pure Value Index’ and ‘U.S. Pure Growth Index’.
‘Momentum’ is typified by techy consumer growth names like Amazon, Facebook and Netflix which continue to sit on triple percentage digit price returns over several years. Banks, insurance firms, makers of capital goods, telecoms and other industrial segments often populate the ‘value’ sphere. What appeared to be the beginnings of a value comeback boosted stocks in many industries that have struggled over the last few years. On Tuesday, this created a sea of green that included all but one S&P 500 bank (the exception was Wells Fargo) also boosting struggling retailer JCPenney above its consensus target price for the first time in several weeks, amid apparently no company specific news.
Absolute change chart: ‘U.S. Pure Value Index’ / ‘U.S. Pure Growth Index’ spread – Daily
Source: Bloomberg /City Index
By Wednesday, the same measures show ‘value’ slumping back sharply. That may not be much of a surprise given the outsize move in the opposite direction earlier in the week. Part of the swing is associated with this week’s resounding government bond market correction as the multi-month rally in developed market bonds and beyond shows signs of fraying. The idea that links a bond correction to a possible swing to value is that if the bond rally may soon peter out, investors might be switching back from chasing absolute bond price gains and returning to yield seeking in shares. With Treasury yields looking less sure-footed into the U.S. cash open though—yields were 1.4 basis points (bp) to 3.2bp lower across the curve—enthusiasm about a switch back to ‘value’ is lower too.
As for whether this week’s events may mark a lasting turn in investors’ prevailing preference, the jury’s out. If bonds (which move inversely to yields) continue rallying on the back of redoubled Fed easing hopes, value may continue to struggle. But what if recession fears bed down deeply enough to trigger a lasting move to the relative safety of ‘value’ stocks against preferences for shares related to other styles, like ‘momentum’, but also ‘volatility’ and others? In that case, eye-catching swings we’ve seen this week could pave the way for lasting changes among stock market leadership.
Chart thoughts
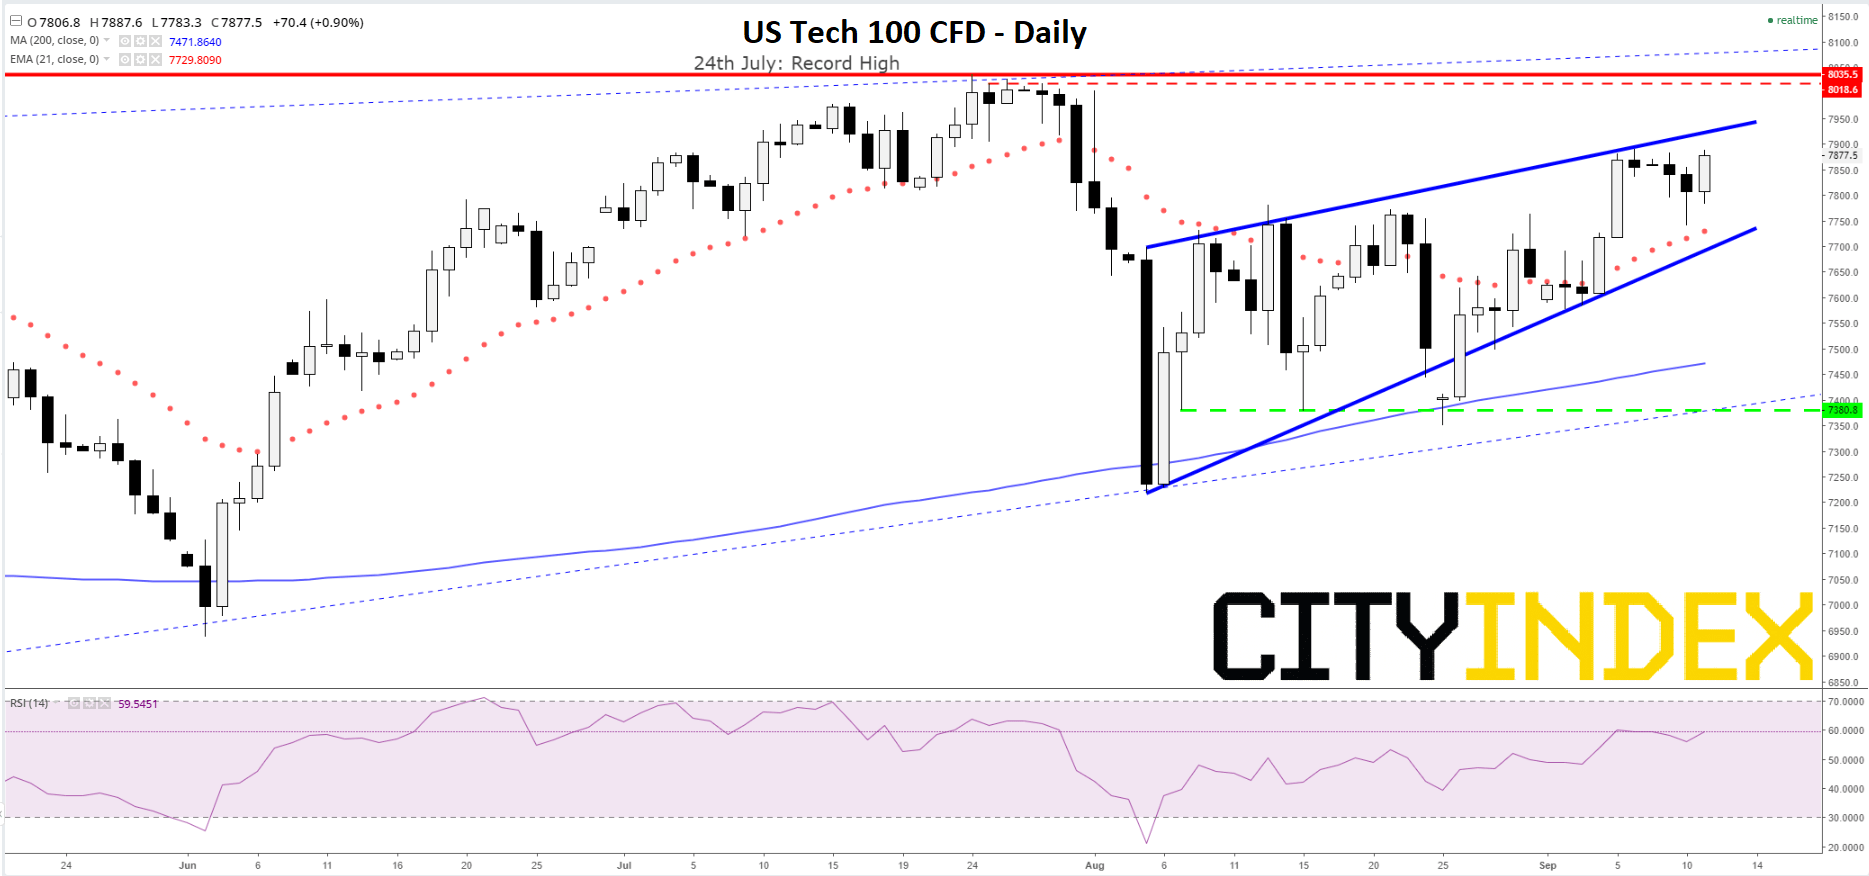
The technology-stock heavy (and thus ‘momentum’ / ‘growth’-sensitive) Nasdaq 100 index is the most relevant backdrop as the eternal battle between those styles comes to a head again. The US Tech 100 CFD proxy shows the market is in a long, slow coil as it hovers close to July’s latest record peak. Closing in, the market’s recovery from August’s mini-correction remains valid, particularly judged from coherence of another ‘coil’ or wedge, forming over several weeks. As it stands, its hypothetical effect is that it will keep funnelling prices higher so long as there are no sustained moves to the downside of the pattern. As prices ascend, the first significant impediments are a moderate distance away. 8018, was the high on the day after July’s record and the best the market could do on its only down day that week. The peak itself was 8035. Even if a ‘value’ takeover really has begun, a bullish-looking Nasdaq chart suggests the shift will be a gradual rather than sudden one, if at all. Even then, true confirmation would still need to wait for 1. A further Nasdaq 100 failure at this year’s top so far, and 2. A clean break of the nearest proven major support, 7308, followed by inarguable follow-through.
US Tech 100 CFD – Daily
Source: City Index
This report is intended for general circulation only. It should not be construed as a recommendation, or an offer (or solicitation of an offer) to buy or sell any financial products. The information provided does not take into account your specific investment objectives, financial situation or particular needs. Before you act on any recommendation that may be contained in this report, independent advice ought to be sought from a financial adviser regarding the suitability of the investment product, taking into account your specific investment objectives, financial situation or particular needs.
StoneX Financial Pte. Ltd., may distribute reports produced by its respective foreign entities or affiliates within the StoneX group of companies or third parties pursuant to an arrangement under Regulation 32C of the Financial Advisers Regulations. Where the report is distributed to a person in Singapore who is not an accredited investor, expert investor or an institutional investor (as defined in the Securities Futures Act), StoneX Financial Pte. Ltd. accepts legal responsibility to such persons for the contents of the report only to the extent required by law. Singapore recipients should contact StoneX Financial Pte. Ltd. at 6826 9988 for matters arising from, or in connection with the report.
In the case of all other recipients of this report, to the extent permitted by applicable laws and regulations neither StoneX Financial Pte. Ltd. nor its associated companies will be responsible or liable for any loss or damage incurred arising out of, or in connection with, any use of the information contained in this report and all such liability is hereby expressly disclaimed. No representation or warranty is made, express or implied, that the content of this report is complete or accurate.
StoneX Financial Pte. Ltd. is not under any obligation to update this report.
Trading CFDs and FX on margin carries a high level of risk that may not be suitable for some investors. Consider your investment objectives, level of experience, financial resources, risk appetite and other relevant circumstances carefully. The possibility exists that you could lose some or all of your investments, including your initial deposits. If in doubt, please seek independent expert advice. Visit www.cityindex.com/en-sg/terms-and-policies for the complete Risk Disclosure Statement.
ALL TRADING INVOLVES RISKS. LOSSES CAN EXCEED DEPOSITS.
City Index is a trading name of StoneX Financial Pte. Ltd. (“SFP”) for the offering of dealing services in Contracts for Differences (“CFD”). SFP holds a Capital Markets Services Licence issued by the Monetary Authority of Singapore for Dealing in Exchange-Traded Derivatives Contracts, Over-the-Counter Derivatives Contracts, and Spot Foreign Exchange Contracts for the Purposes of Leveraged Foreign Exchange Trading. SFP is also both Derivatives Trading and Clearing member of the Singapore Exchange (“SGX”). SFP is a wholly-owned subsidiary of StoneX Group Inc.
The information provided herein is intended for general circulation. It does not take into account the specific investment objectives, financial situation or particular needs of any particular person. You should take into account your specific investment objectives, financial situation or particular needs before making a commitment to invest, including seeking advice from an independent financial adviser regarding the suitability of the investment, under a separate engagement, as you deem fit. No representation or warranty is given as to the accuracy or completeness of this information. Consequently, any person acting on it does so entirely at their own risk.
The information does not represent an offer of, or solicitation for, a transaction in any investment product. Any views and opinions expressed may be changed without an update. To understand the risks and costs involved, please visit the section captioned “Important Information” and the “Risk Disclosure Statement”.
The information herein is not directed to, or intended for distribution to or use by, any person or entity who is a citizen or resident of or located in any locality, state, country or other jurisdiction where such distribution, publication, availability or use would be contrary to law or regulation.
StoneX Financial Pte. Ltd. 1 Raffles Place, #18-61, One Raffles Place Tower 2, Singapore 048616. Tel: 6309 1000. Co. Reg. No.: 201130598R.
This advertisement has not been reviewed by the Monetary Authority of Singapore.
© City Index 2024