Hong Kong stocks the weakest link on the backdrop of global manufacturing recession
Yesterday, we have finally witnessed the U.S. manufacturing sector succumbed to downside pressure in line with the on-going deterioration seen in global manufacturing activities that have been weaken further by the U.S.-China trade war. The U.S. ISM Manufacturing PMI for Sep has slumped to 47.80 versus a consensus reading of 50.1 and declined further from 49.1 seen in Aug. The latest set of data represents two consecutive months of contraction (below 50) in U.S. manufacturing activities that triggered a sell-off in U.S. stocks.
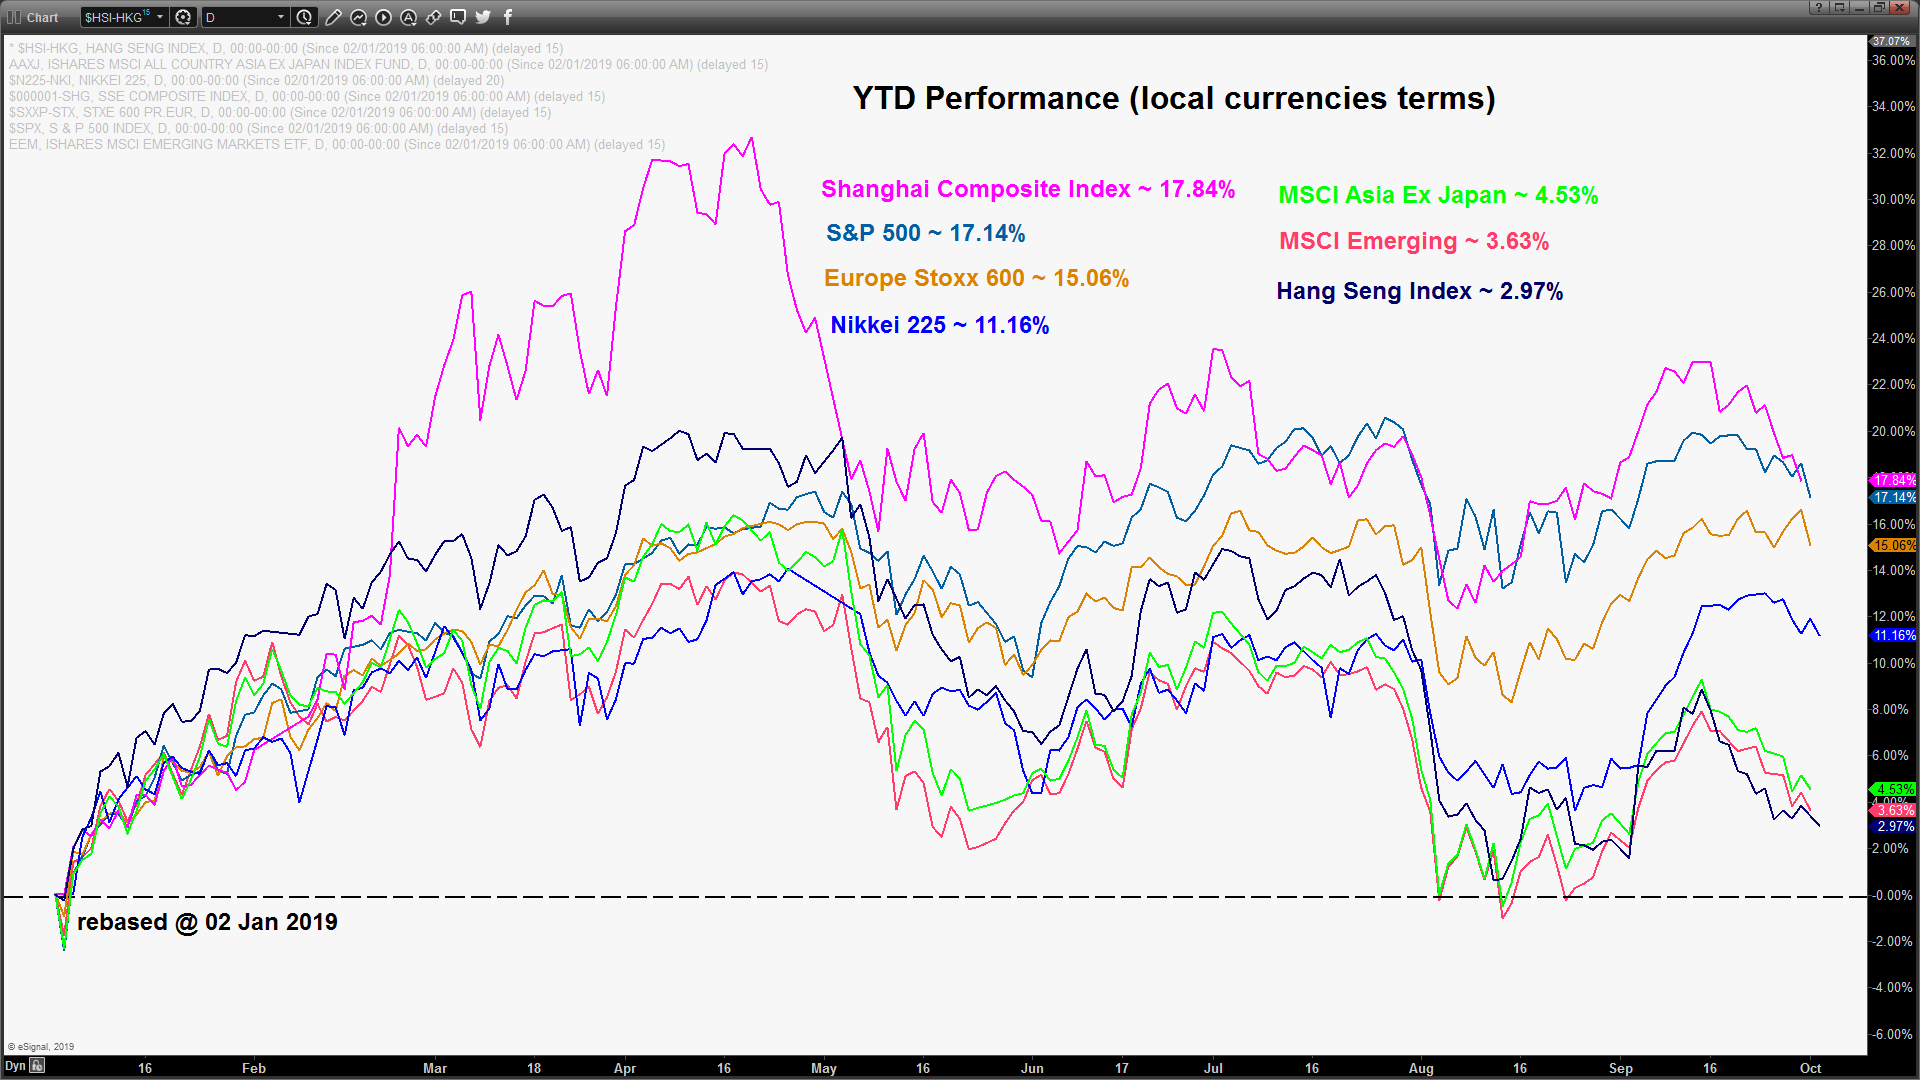
After yesterday’s decline of -1.23% seen in the S&P 500; the benchmark index for the U.S. stock market, it is still the top performer year to date with a gain of 17.14%, slightly below the Shanghai Composite Index of 17.84%.
From a tactical trading strategy perspective, one can look at the overall performance of the major global stock markets and target the weakest on back drop of an imminent global recession. The Hong Kong’s Hang Seng Index is the worst performer so far with a paltry gain of 2.97% hit by a double whammy of weak external environment and a deterioration in internal consumer/business sentiment due to the 4-month long of localised anti-government street protests.
Next, we will highlight several Hong Kong listed stocks with bearish technical elements for a time frame of 1 to 3 weeks.
Hong Kong’s Hang Seng Index the worst performer
click to enlarge chart
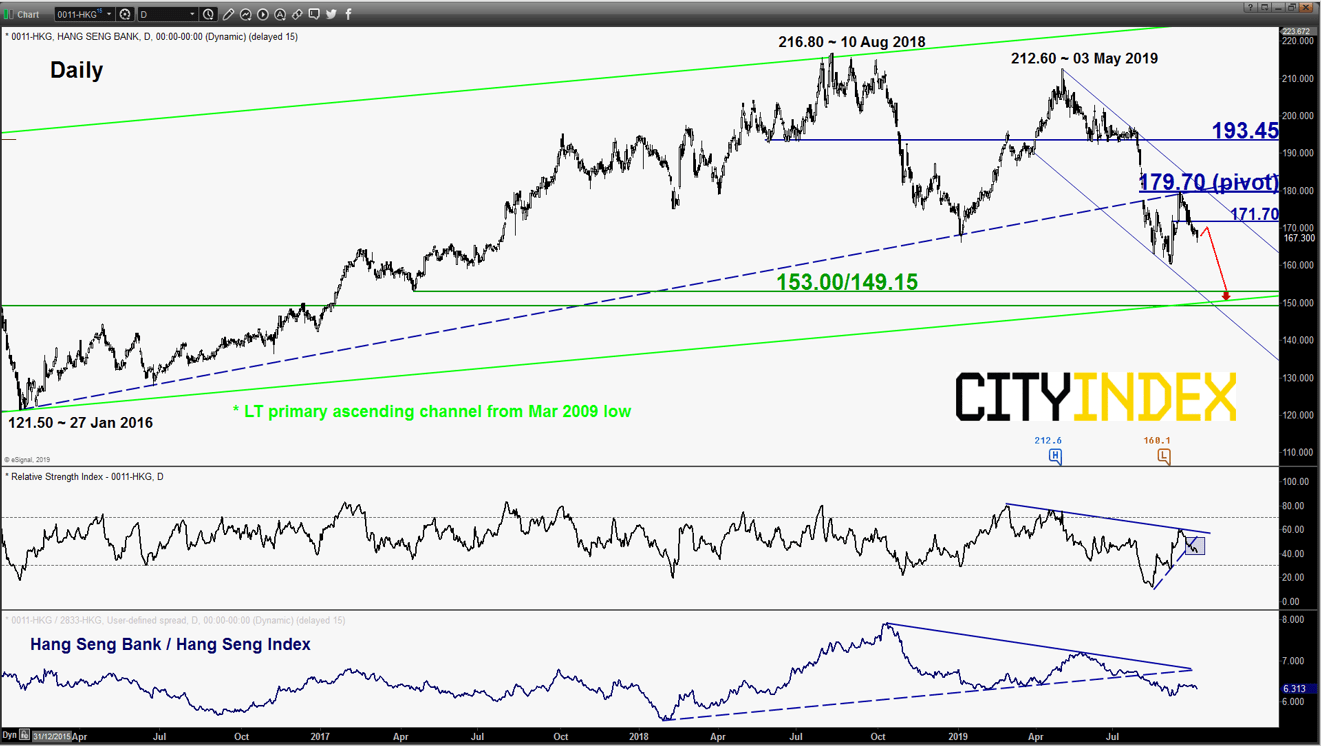
Hang Seng Bank (0011-HKG)
click to enlarge chart
- Bearish bias in any bounces below key pivotal resistance of 179.70 for further potential downleg to target the key long-term support area of 153.00/149.15.
- It has been evolving within a major descending channel in place since 03 May 2019 and it has retreated from the pull-back resistance of a former ascending support from 27 Jan 2016 after a corrective rebound of 11.7% from its 03 Sep 2019 low of 160.10.
- Momentum remains negative as indicated by the daily RSI oscillator where it has staged a bearish breakdown below a significant corresponding support at the 45 level. In addition, relative strength analysis from the ratio chart of Hang Seng Bank over HSI suggests further potential underperformance of Hang Seng Bank against the Hang Seng Index.
- However, a clearance with daily close above 179.70 invalidates the bearish scenario for a squeeze up to retest the 193.45 former range support from Jun/July 2019.
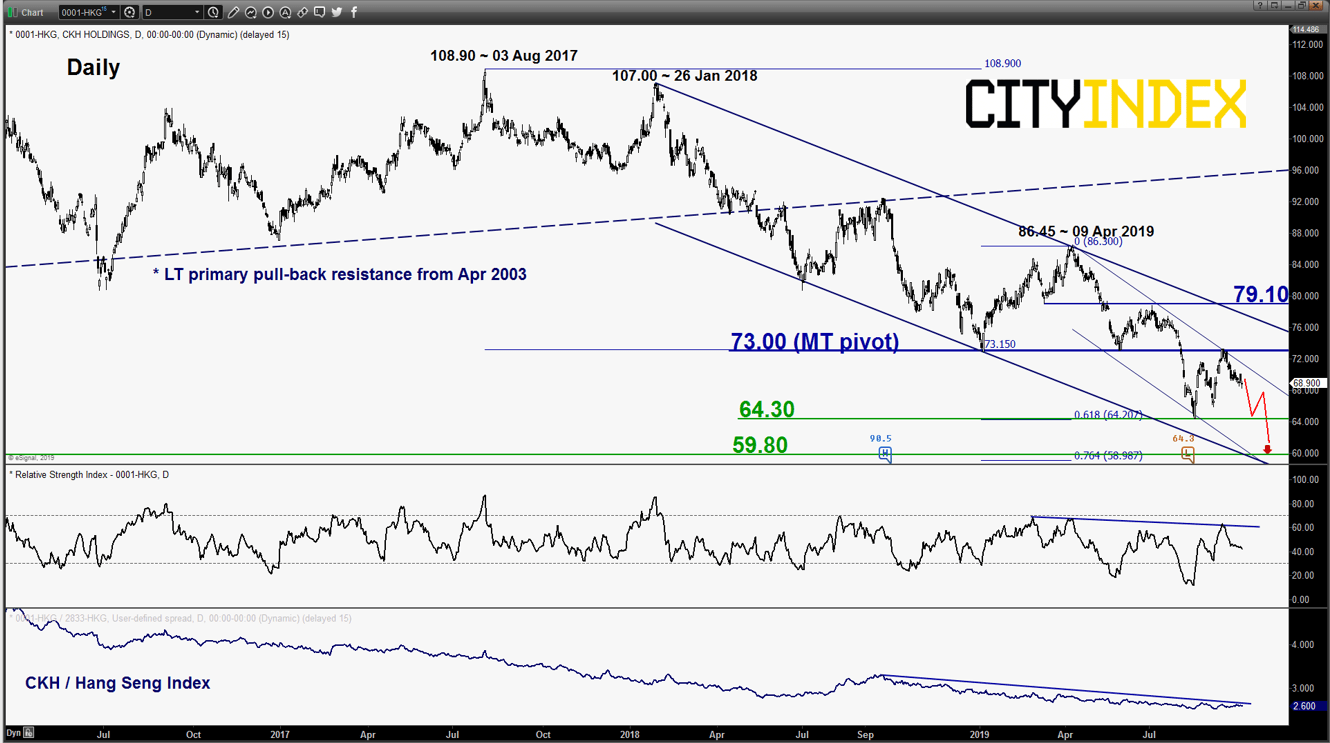
CKH Holdings (0001-HKG)
click to enlarge chart
- CKH Holdings, a major conglomerate set up by Li Ka-shing, an influential business magnate and one of Asia’s richest tycoons. Bearish bias in any bounces below 73.00 key pivotal resistance for further potential downleg to retest the 15 Aug 2019 swing low of 64.30 before targeting the 59.80 support (lower boundary of medium-term ascending channel in place since 09 Apr 2019 high & a Fibonacci expansion cluster).
- The ratio chart of CKH Holdings over HSI has continued to evolve in a downtrend since Oct 2018 which suggests further potential underperformance of CKH Holdings against the Hang Seng Index.
- However, a clearance with daily close above 73.00 invalidates the bearish scenario for an extension of the corrective rebound from 15 Aug 2019 low towards the next resistance at 79.10 (also the upper boundary of the major descending channel from 26 Jan 2018 high).
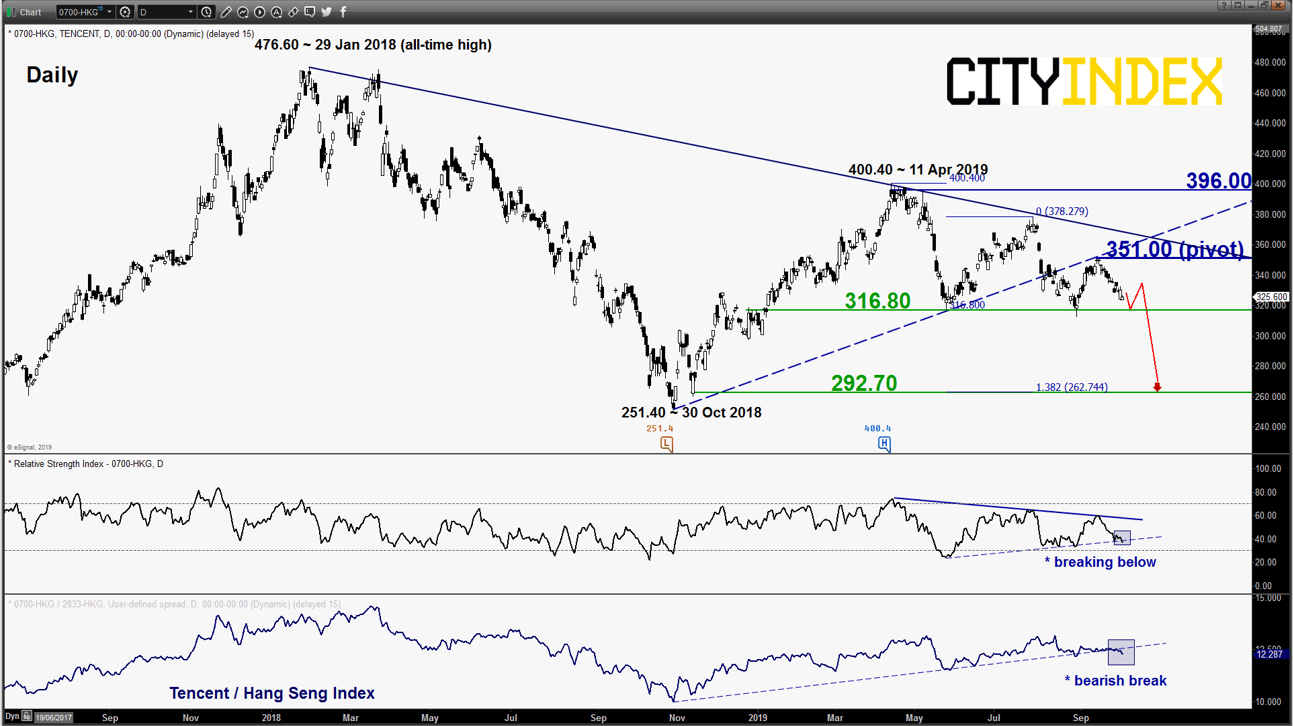
Tencent Holdings (0700-HKG)
click to enlarge chart
- Tencent, one of the trios from the BAT group; an acronym for high beta giant technology stocks based in Asia (Baidu, Alibaba) that derive their most of their revenue from China and it is also the 2nd highest weightage component stock in Hang Seng Index.
- Bearish bias in any bounces below 351.00 key pivotal resistance and a break below 316.80 (range support in place since 27 May 2019) is likely to reinforce another potential downleg to target the next support at 292.70 (close to the 30 Oct 2018 major swing low & 1.382 Fibonacci expansion of the decline from 11 Apr high to 27 May low projected from 30 Jul 2019 high).
- The stock has continued to form a series of “lower highs” below a major descending trendline resistance in place since its current all-time high of 476.60 printed on 29 Jan 2018.
- Momentum remains negative as the daily RSI oscillator is now attempting a bearish breakdown below a significant corresponding support at the 38 level. This observation suggests a potential pre-signal for a break below the 316.80 range support.
- The ratio of Tencent over HSI has broken below a significant ascending support in place since 30 Oct 2018 which indicates a further potential underperformance of Tencent against the Hang Seng Index.
- However, a clearance with daily close above 351.00 invalidates the bearish scenario for a squeeze up to retest the 11 Apr 2019 swing high area of 396.00.
Charts are from eSignal
This report is intended for general circulation only. It should not be construed as a recommendation, or an offer (or solicitation of an offer) to buy or sell any financial products. The information provided does not take into account your specific investment objectives, financial situation or particular needs. Before you act on any recommendation that may be contained in this report, independent advice ought to be sought from a financial adviser regarding the suitability of the investment product, taking into account your specific investment objectives, financial situation or particular needs.
StoneX Financial Pte. Ltd., may distribute reports produced by its respective foreign entities or affiliates within the StoneX group of companies or third parties pursuant to an arrangement under Regulation 32C of the Financial Advisers Regulations. Where the report is distributed to a person in Singapore who is not an accredited investor, expert investor or an institutional investor (as defined in the Securities Futures Act), StoneX Financial Pte. Ltd. accepts legal responsibility to such persons for the contents of the report only to the extent required by law. Singapore recipients should contact StoneX Financial Pte. Ltd. at 6826 9988 for matters arising from, or in connection with the report.
In the case of all other recipients of this report, to the extent permitted by applicable laws and regulations neither StoneX Financial Pte. Ltd. nor its associated companies will be responsible or liable for any loss or damage incurred arising out of, or in connection with, any use of the information contained in this report and all such liability is hereby expressly disclaimed. No representation or warranty is made, express or implied, that the content of this report is complete or accurate.
StoneX Financial Pte. Ltd. is not under any obligation to update this report.
Trading CFDs and FX on margin carries a high level of risk that may not be suitable for some investors. Consider your investment objectives, level of experience, financial resources, risk appetite and other relevant circumstances carefully. The possibility exists that you could lose some or all of your investments, including your initial deposits. If in doubt, please seek independent expert advice. Visit www.cityindex.com/en-sg/terms-and-policies for the complete Risk Disclosure Statement.
ALL TRADING INVOLVES RISKS. LOSSES CAN EXCEED DEPOSITS.
City Index is a trading name of StoneX Financial Pte. Ltd. (“SFP”) for the offering of dealing services in Contracts for Differences (“CFD”). SFP holds a Capital Markets Services Licence issued by the Monetary Authority of Singapore for Dealing in Exchange-Traded Derivatives Contracts, Over-the-Counter Derivatives Contracts, and Spot Foreign Exchange Contracts for the Purposes of Leveraged Foreign Exchange Trading. SFP is also both Derivatives Trading and Clearing member of the Singapore Exchange (“SGX”). SFP is a wholly-owned subsidiary of StoneX Group Inc.
The information provided herein is intended for general circulation. It does not take into account the specific investment objectives, financial situation or particular needs of any particular person. You should take into account your specific investment objectives, financial situation or particular needs before making a commitment to invest, including seeking advice from an independent financial adviser regarding the suitability of the investment, under a separate engagement, as you deem fit. No representation or warranty is given as to the accuracy or completeness of this information. Consequently, any person acting on it does so entirely at their own risk.
The information does not represent an offer of, or solicitation for, a transaction in any investment product. Any views and opinions expressed may be changed without an update. To understand the risks and costs involved, please visit the section captioned “Important Information” and the “Risk Disclosure Statement”.
The information herein is not directed to, or intended for distribution to or use by, any person or entity who is a citizen or resident of or located in any locality, state, country or other jurisdiction where such distribution, publication, availability or use would be contrary to law or regulation.
StoneX Financial Pte. Ltd. 1 Raffles Place, #18-61, One Raffles Place Tower 2, Singapore 048616. Tel: 6309 1000. Co. Reg. No.: 201130598R.
This advertisement has not been reviewed by the Monetary Authority of Singapore.
© City Index 2024