Historically How Bearish Has A Bearish Outside Week Been On The ASX200
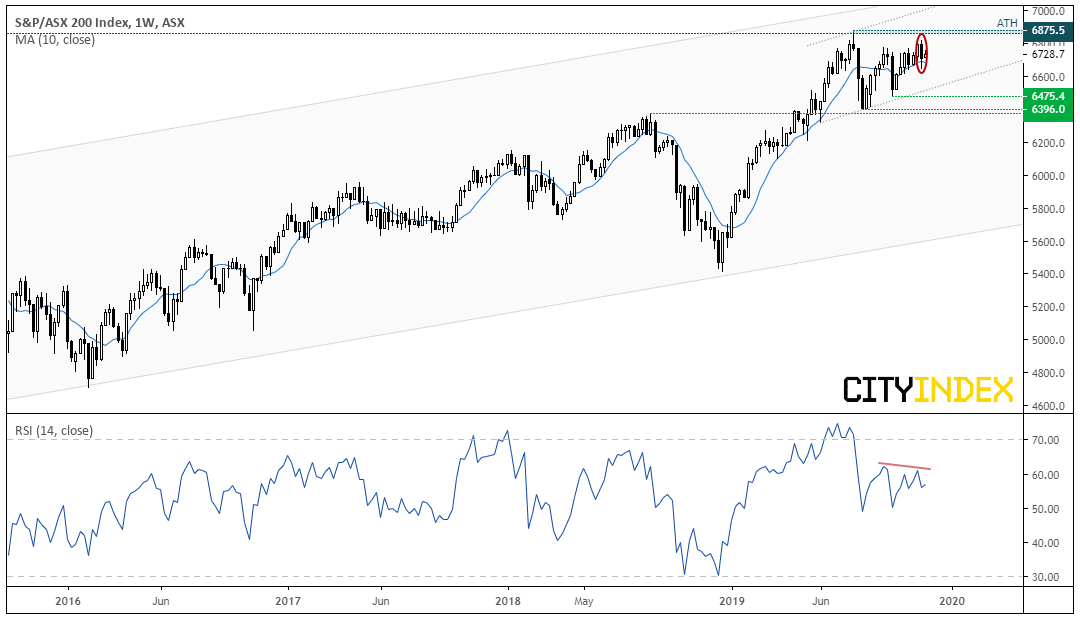
By Friday’s close, the ASX200 had produced a bearish outside week after failing to hold above 6,800 which raises the potential for some mean reversion. Given the slight bearish divergence forming with RSI and the clear loss of momentum leading it back towards its all-time high, we explore the bearish potential of this classic candlestick pattern to see if it can pull the rug from under Santa’s rally in December.
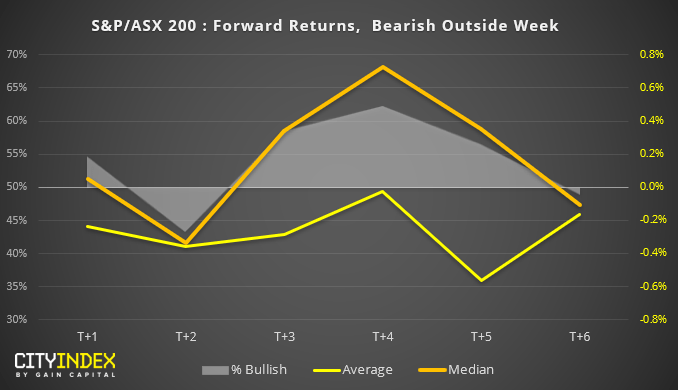
The test: Using Reuters data since April 2000, we filtered all bearish outside candles on the weekly chart. We have then calculated forward returns following a bearish outside candle, along with the % of bullish closes of the forward returns.
As we’re testing a bearish pattern, ideally we’d want to see negative returns with a % bullish rate below 50%.
- The week following a bearish outside candle tends to close higher more often than not and median returns are also positive, whilst average returns are negative (currently the ASX200 is trading higher this week but we’ll see how this plays out).
- From this data set, 2 weeks after a bearish outside week has produced the most bearish average and median returns, with the highest success rate (as they only close higher on 43.4% of the times). Also note that median returns are also negative suggesting the results are more consistent. Whilst average returns are larger 5 weeks out, it clearly diverges with median returns to show that outliers have weighed this average down.
- Whilst average returns are negative between 1-6 weeks after the pattern, median returns (or typical returns) are positive and close higher over 50% of the time. This suggests a few outliers have pushed average returns into negative territory, yet they typically close higher more often than not.
However, as this filters all bearish outside candles, trend direction has not been considered. So next we apply a rule where the pattern must close above or below its 10-week average to denote a basic trend filter.
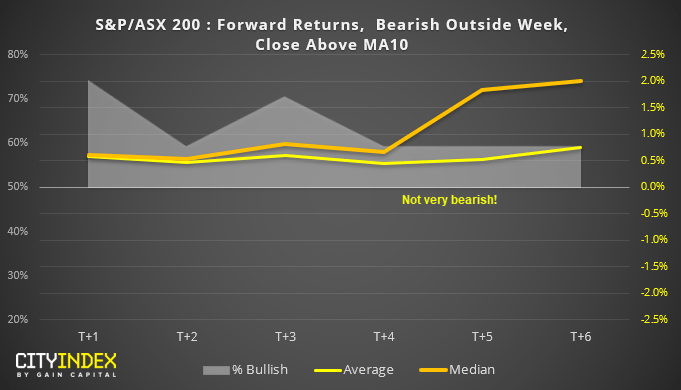
Bearish outside day with a close above its 10-week MA
- In short, not very bearish at all.
- Average and median returns are positive between 1 to 6 weeks later, and all have a positive expectancy with % bullish above zero.
- It’s interesting to note that median returns accelerate 5-6 weeks later
- The week after the pattern (or this week) has a % bullish rate of 75%!
- However, there are only 27 instances of this occurring since 2000 (generally its good practice to have a minimum of 30 occurrences).
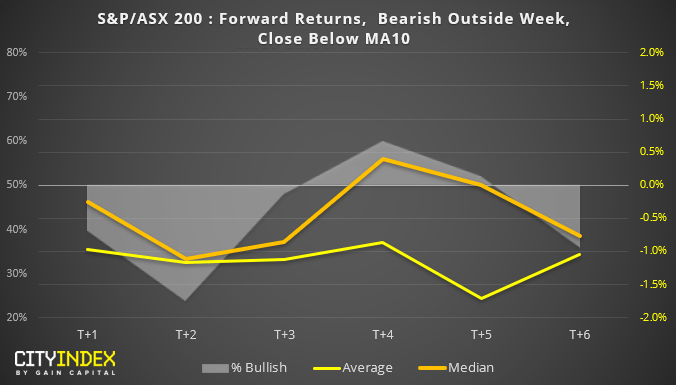
Bearish outside day with a close below its 10-week MA
- That’s a bit more like it…
- Again we see +2 weeks as optimal to bears, as both average and median returns are bearish. Moreover, bullish closes are just 24% which means it has closed lower 76% of the time.
- The relationship breaks down around 4 weeks later as median returns are positive over 50% of the time.
- Ultimately, it has been better at picking near-term reversals over longer-term ones.
- However, there are only 25 instances of this occurring since 2000 which is below the ideal sample of 30 or above.
Final thoughts:
- Two weeks after a bearish engulfing candle appears optimum for bears, unless it has closed above its 10-week MA. (take note, the ASX200 closed above its 10-week MA last week).
- Moreover, with average, median and % of bullish closes all positive up to 6 weeks after the bearish outside week closes above its 10-week MA, it appears to be more of a bear-trap signal if anything.
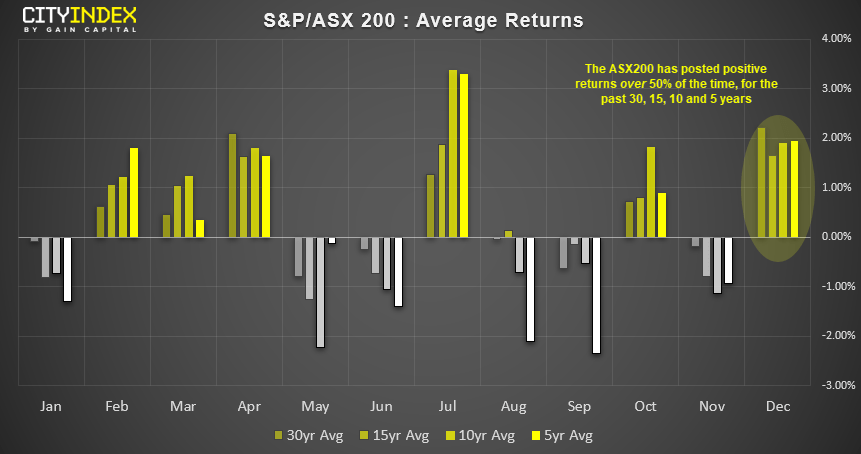
- Moreover, December has historically been the most bullish month of the year for the ASX200. Average returns are over 2% over the past 30 years, and it has also posted positive average returns over 50% of the time over the past 30, 15, 10 and 5 years.
- Given its tendency to rally in December and post positive returns if a bearish engulfing candle closes above its 10-week average, the ASX200 could still rally over the next few weeks.
Related Analysis (City Index):
ASX200: The Long And Short Of It | NAN, GXY, REA, BPT
Weekly and Monthly Bearish Engulfing Candles Appear On DXY - But Just How Grizzly Are They?
How WTI Has Traded Following Bullish Spikes Of The Past
Forward Returns Following A US10-2 Year Inversion
Bitcoin: Do Volatile Bullish Sessions Lead To Further Gains?
This report is intended for general circulation only. It should not be construed as a recommendation, or an offer (or solicitation of an offer) to buy or sell any financial products. The information provided does not take into account your specific investment objectives, financial situation or particular needs. Before you act on any recommendation that may be contained in this report, independent advice ought to be sought from a financial adviser regarding the suitability of the investment product, taking into account your specific investment objectives, financial situation or particular needs.
StoneX Financial Pte. Ltd., may distribute reports produced by its respective foreign entities or affiliates within the StoneX group of companies or third parties pursuant to an arrangement under Regulation 32C of the Financial Advisers Regulations. Where the report is distributed to a person in Singapore who is not an accredited investor, expert investor or an institutional investor (as defined in the Securities Futures Act), StoneX Financial Pte. Ltd. accepts legal responsibility to such persons for the contents of the report only to the extent required by law. Singapore recipients should contact StoneX Financial Pte. Ltd. at 6826 9988 for matters arising from, or in connection with the report.
In the case of all other recipients of this report, to the extent permitted by applicable laws and regulations neither StoneX Financial Pte. Ltd. nor its associated companies will be responsible or liable for any loss or damage incurred arising out of, or in connection with, any use of the information contained in this report and all such liability is hereby expressly disclaimed. No representation or warranty is made, express or implied, that the content of this report is complete or accurate.
StoneX Financial Pte. Ltd. is not under any obligation to update this report.
Trading CFDs and FX on margin carries a high level of risk that may not be suitable for some investors. Consider your investment objectives, level of experience, financial resources, risk appetite and other relevant circumstances carefully. The possibility exists that you could lose some or all of your investments, including your initial deposits. If in doubt, please seek independent expert advice. Visit www.cityindex.com/en-sg/terms-and-policies for the complete Risk Disclosure Statement.
ALL TRADING INVOLVES RISKS. LOSSES CAN EXCEED DEPOSITS.
City Index is a trading name of StoneX Financial Pte. Ltd. (“SFP”) for the offering of dealing services in Contracts for Differences (“CFD”). SFP holds a Capital Markets Services Licence issued by the Monetary Authority of Singapore for Dealing in Exchange-Traded Derivatives Contracts, Over-the-Counter Derivatives Contracts, and Spot Foreign Exchange Contracts for the Purposes of Leveraged Foreign Exchange Trading. SFP is also both Derivatives Trading and Clearing member of the Singapore Exchange (“SGX”). SFP is a wholly-owned subsidiary of StoneX Group Inc.
The information provided herein is intended for general circulation. It does not take into account the specific investment objectives, financial situation or particular needs of any particular person. You should take into account your specific investment objectives, financial situation or particular needs before making a commitment to invest, including seeking advice from an independent financial adviser regarding the suitability of the investment, under a separate engagement, as you deem fit. No representation or warranty is given as to the accuracy or completeness of this information. Consequently, any person acting on it does so entirely at their own risk.
The information does not represent an offer of, or solicitation for, a transaction in any investment product. Any views and opinions expressed may be changed without an update. To understand the risks and costs involved, please visit the section captioned “Important Information” and the “Risk Disclosure Statement”.
The information herein is not directed to, or intended for distribution to or use by, any person or entity who is a citizen or resident of or located in any locality, state, country or other jurisdiction where such distribution, publication, availability or use would be contrary to law or regulation.
StoneX Financial Pte. Ltd. 1 Raffles Place, #18-61, One Raffles Place Tower 2, Singapore 048616. Tel: 6309 1000. Co. Reg. No.: 201130598R.
This advertisement has not been reviewed by the Monetary Authority of Singapore.
© City Index 2024