Gold Perks Up But Its Not Out Of The Woods
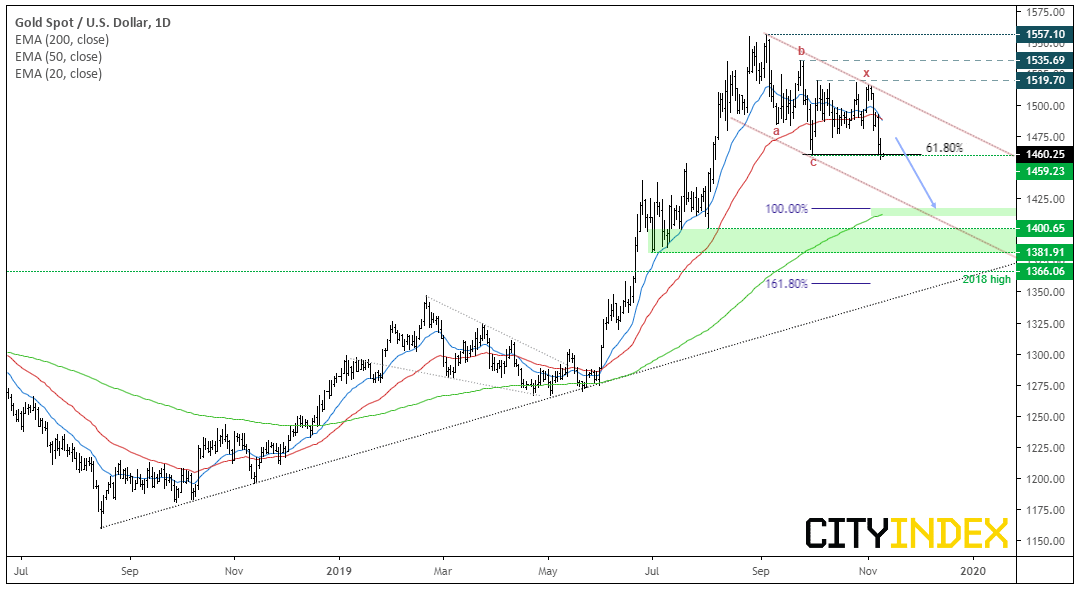
Overall, gold has a decent chance of breaking to new highs over the coming month/s. Yet whether is opts for direct gains or morphs into a prolonged, complex correction could become clear over the next week.
The breakout from the bearish/corrective channel on Friday threw a spanner in the works with its bearish pinbar. Whilst this warned of a bull-trap, bears struggled to push it lower this week we’ve seen another higher low. Whilst this suggests there’s demand around the 1475-1480 area, it’s touch and go as to whether prices can lift off from here.
Technically, there’s two variations of a bullish scenario would could play out. The former requires direct gains, the other could see the correction drag out before the rally truly resumes.
- We’ve seen the end an ABC correction at 1459, and a break above 1520 assumes we’re in wave 3 of an impulsive move (which should break to new high). However, we’d need to see bullish momentum return soon and exhibit a directional move associated with a wave 3
- Or… we’re still in a complex correction, and the initial ABC move which terminated at 1459 is the first zig-zag of a larger, corrective pattern. This scenario becomes more likely if any break higher fizzles out and retreats lower once more.
Vaneck Vectors Gold ETF CFD/DFT:
Still, whilst we wait for spot god to make up its mind, we’re also tracking a potentially bullish move on GDX (gold miners index). Prices have recently broken out of a bullish wedge formation (a continuation pattern in an uptrend) and on the cusp of testing key resistance at 28.35. If successful, the pattern projects an initial target around the highs near 31.
- Bulls could look for a break above 28.35 to assumes a run towards 30.36.
- Alternatively, if prices reverse (presumably) with gold, then a break of key support around 26 could provide an equally compelling short signal to bears.
Kirkland Lake Gold CFD/DTF:
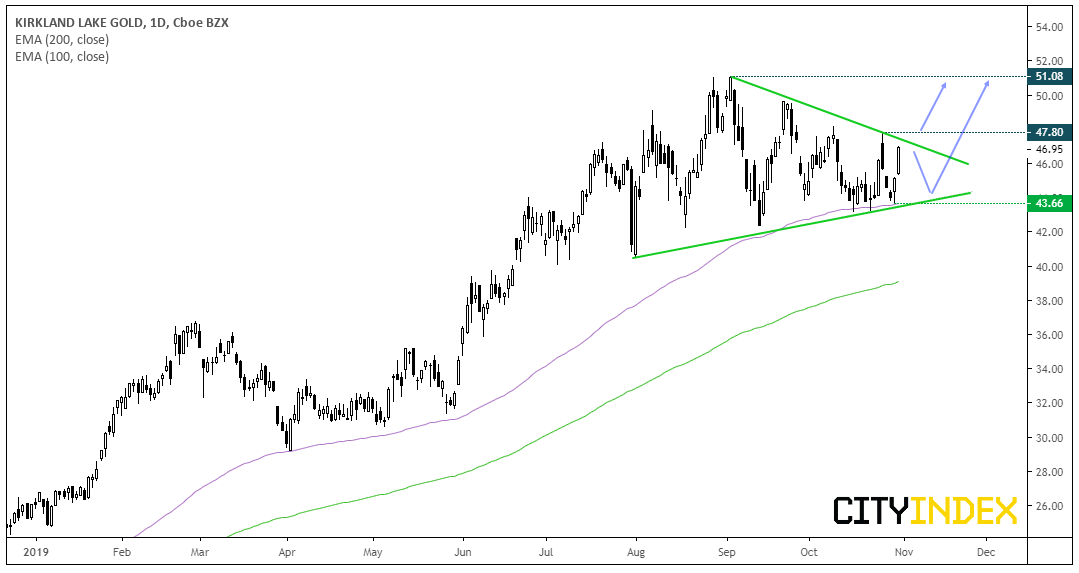
A tidy correction has seen prices respect the 100-day eMA and compress within a symmetrical triangle formation. Given this is typically a continuation pattern, shows a bullish trend structure is and the 2nd best performer YTD from the top-10 GDX constituents, our bias is for a bullish breakout.
- Bulls could either wait for a break or daily close above the descending trendline. For added confirmation, wait for a break/close above 47.80.
- Initial target is the 51.08 high but, due to the overall strength of the trend, we anticipate it to break to new highs if gold’s rally resumes.
- If gold struggles to break higher, we could see compression tighten further within the triangle. Unless of course gold rolls over, then it could spoil this otherwise textbook technical setup.
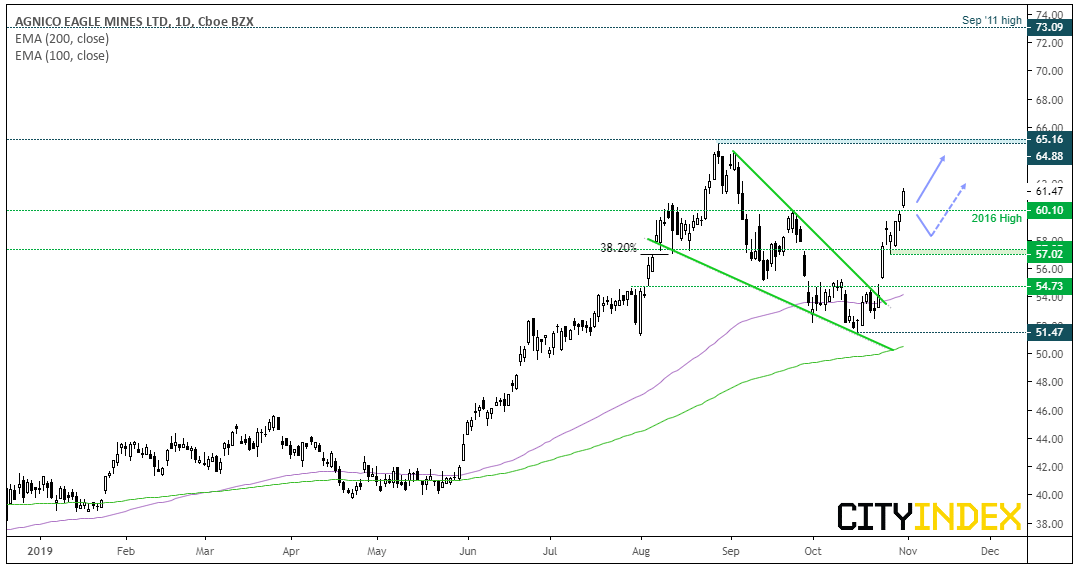
Agnico-Eagle Mines CFD/DTF:
Strong earnings last week saw prices gap higher out of a bullish wedge pattern. If successful, the pattern projects an approximate target around the base of the pattern at 64.88. And if gold is to break to new highs then perhaps a run towards 70 and 73 are on the cards (the Sep ’11 high). For now, momentum remains strong and support levels are nearby at 60 and 57.
- Momentum traders could seek bullish setups on intraday timeframes.
- If trading the daily chart, bulls could seek to buy dips around the 60 and 57 support levels.
- The daily trend remains bullish above the 51.47 low, yet we wouldn’t be seeking to buy sips if prices retrace to such a level. So we’d probably step aside if it broken beneath 57.
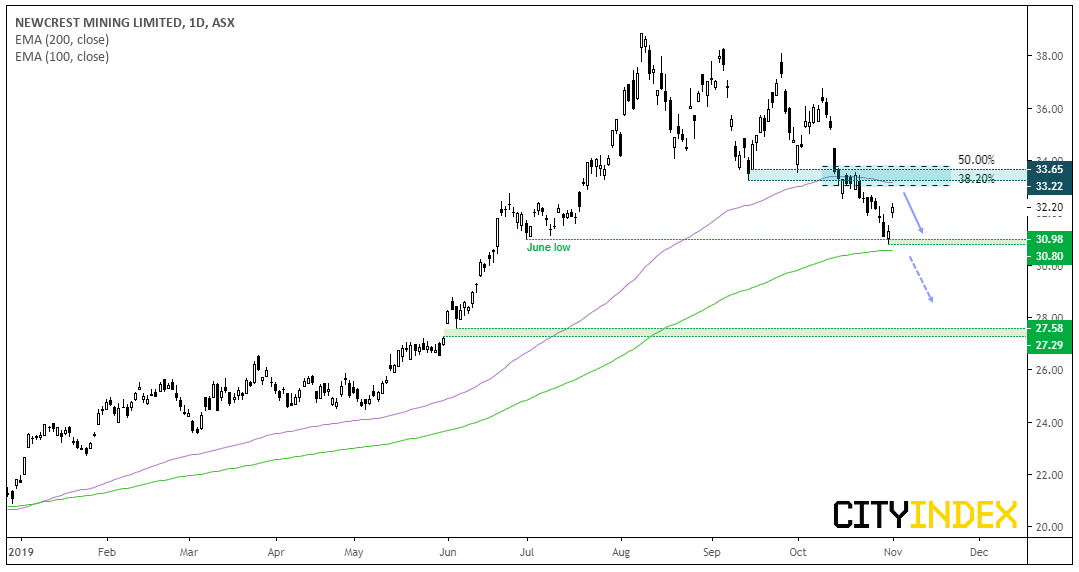
Newcrest Mining Limited CFD:
Newcrest is one to consider if the lust for gold fizzles out. Since its August peak, price action became erratic and choppy which itself can be the clues for a top. In mid-October, bears drove it beneath 32 into a small bearish flag before breaking beneath the 100-day eMA and heading for the June lows. Whilst the 200-day eMA is holding as support, momentum favours the bear-camp and a bearish trend structure.
- The bias remains bearish whilst prices trade below the 32-34 resistance zone, therefor the current bounce is assumed to be corrective
- Bears can fade into rallies beneath the resistance zone, assuming an eventual break to new low.
- Alternatively, wait for a break below 30; as this will invalidate the 200-day eMA and take it to a fresh cycle low
This report is intended for general circulation only. It should not be construed as a recommendation, or an offer (or solicitation of an offer) to buy or sell any financial products. The information provided does not take into account your specific investment objectives, financial situation or particular needs. Before you act on any recommendation that may be contained in this report, independent advice ought to be sought from a financial adviser regarding the suitability of the investment product, taking into account your specific investment objectives, financial situation or particular needs.
StoneX Financial Pte. Ltd., may distribute reports produced by its respective foreign entities or affiliates within the StoneX group of companies or third parties pursuant to an arrangement under Regulation 32C of the Financial Advisers Regulations. Where the report is distributed to a person in Singapore who is not an accredited investor, expert investor or an institutional investor (as defined in the Securities Futures Act), StoneX Financial Pte. Ltd. accepts legal responsibility to such persons for the contents of the report only to the extent required by law. Singapore recipients should contact StoneX Financial Pte. Ltd. at 6826 9988 for matters arising from, or in connection with the report.
In the case of all other recipients of this report, to the extent permitted by applicable laws and regulations neither StoneX Financial Pte. Ltd. nor its associated companies will be responsible or liable for any loss or damage incurred arising out of, or in connection with, any use of the information contained in this report and all such liability is hereby expressly disclaimed. No representation or warranty is made, express or implied, that the content of this report is complete or accurate.
StoneX Financial Pte. Ltd. is not under any obligation to update this report.
Trading CFDs and FX on margin carries a high level of risk that may not be suitable for some investors. Consider your investment objectives, level of experience, financial resources, risk appetite and other relevant circumstances carefully. The possibility exists that you could lose some or all of your investments, including your initial deposits. If in doubt, please seek independent expert advice. Visit www.cityindex.com/en-sg/terms-and-policies for the complete Risk Disclosure Statement.
ALL TRADING INVOLVES RISKS. LOSSES CAN EXCEED DEPOSITS.
City Index is a trading name of StoneX Financial Pte. Ltd. (“SFP”) for the offering of dealing services in Contracts for Differences (“CFD”). SFP holds a Capital Markets Services Licence issued by the Monetary Authority of Singapore for Dealing in Exchange-Traded Derivatives Contracts, Over-the-Counter Derivatives Contracts, and Spot Foreign Exchange Contracts for the Purposes of Leveraged Foreign Exchange Trading. SFP is also both Derivatives Trading and Clearing member of the Singapore Exchange (“SGX”). SFP is a wholly-owned subsidiary of StoneX Group Inc.
The information provided herein is intended for general circulation. It does not take into account the specific investment objectives, financial situation or particular needs of any particular person. You should take into account your specific investment objectives, financial situation or particular needs before making a commitment to invest, including seeking advice from an independent financial adviser regarding the suitability of the investment, under a separate engagement, as you deem fit. No representation or warranty is given as to the accuracy or completeness of this information. Consequently, any person acting on it does so entirely at their own risk.
The information does not represent an offer of, or solicitation for, a transaction in any investment product. Any views and opinions expressed may be changed without an update. To understand the risks and costs involved, please visit the section captioned “Important Information” and the “Risk Disclosure Statement”.
The information herein is not directed to, or intended for distribution to or use by, any person or entity who is a citizen or resident of or located in any locality, state, country or other jurisdiction where such distribution, publication, availability or use would be contrary to law or regulation.
StoneX Financial Pte. Ltd. 1 Raffles Place, #18-61, One Raffles Place Tower 2, Singapore 048616. Tel: 6309 1000. Co. Reg. No.: 201130598R.
This advertisement has not been reviewed by the Monetary Authority of Singapore.
© City Index 2024