FTSE The Long And Short Of It AVST BA GRG
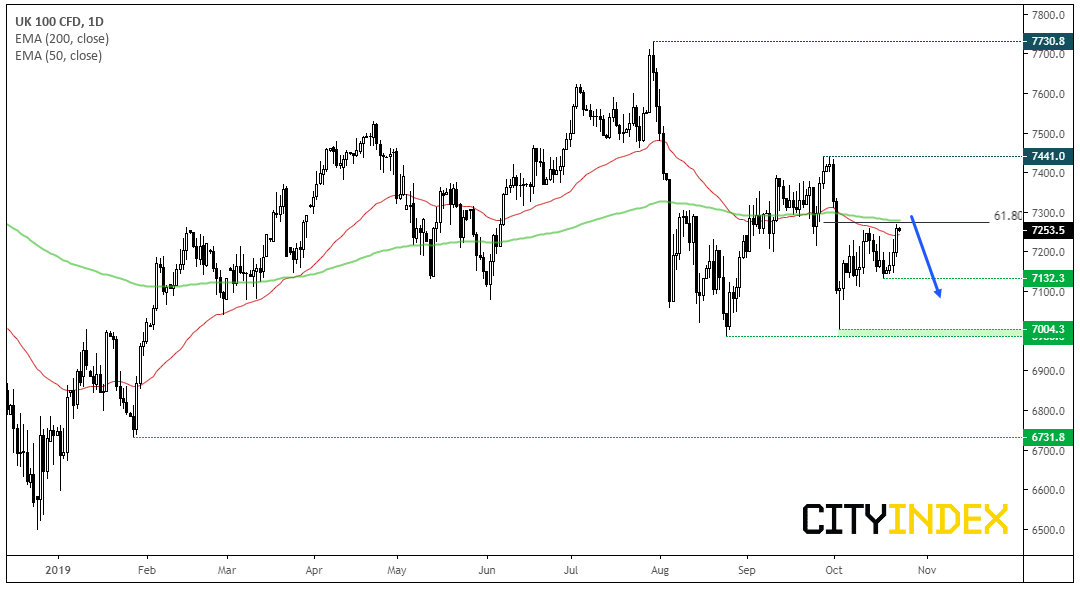
The FTSE 100 continues to chop its way around between key levels, yet with resistance nearby, upside could now be limited.
The recovery form 7000 has so far come in 3 waves. As momentum from the lows pales in comparison to the decline from 7441 to 7000 the rebound still looks corrective. Furthermore, yesterday’s high is now trading just below the 200-day eMA (and between the 50-200 eMA zone) and stopped just shy of the 61.8% Fibonacci retracement level. Therefor upside could be limited unless we see a global rebound across equities. For now, bears could look to fade into area of weakness and seek signs of a top. After which the 7132 and 7000 lows come into focus for the bear-camp.
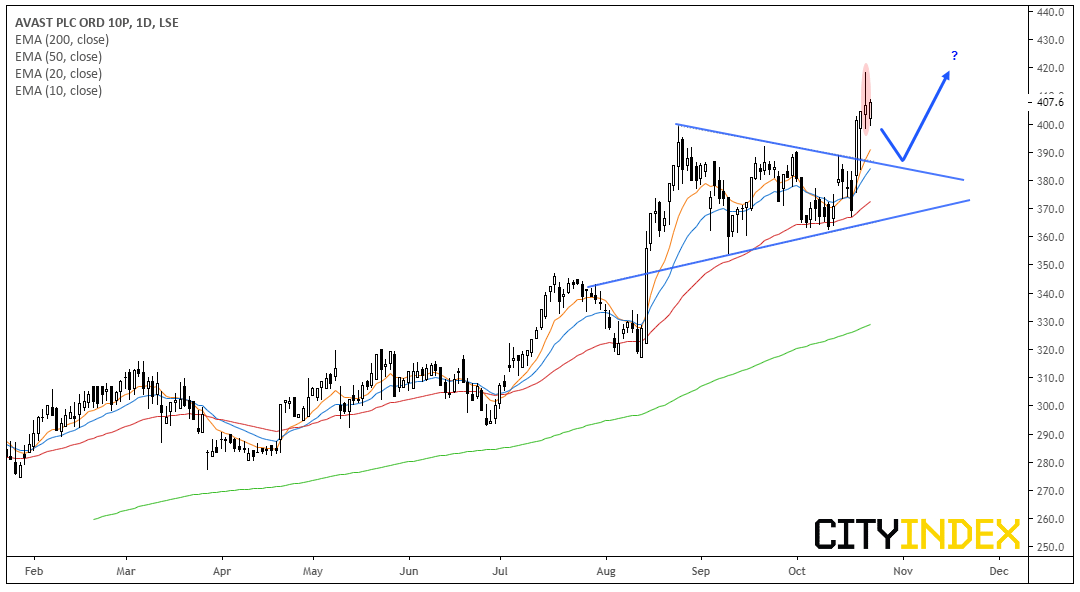
Avast CFD/DFT (AVST): Trading just off its record high after breaking out of a symmetrical triangle, we’re waiting for price to consolidate or pull back for a better entry. Up 43.5% YTD, the software and security company has outperformed the FTSE 350 this year, it looks like momentum is just ramping up. However, given the bearish hammer and extended distance from the eMA’s, we’d prefer to see a higher low form before assuming new highs and trend continuation.
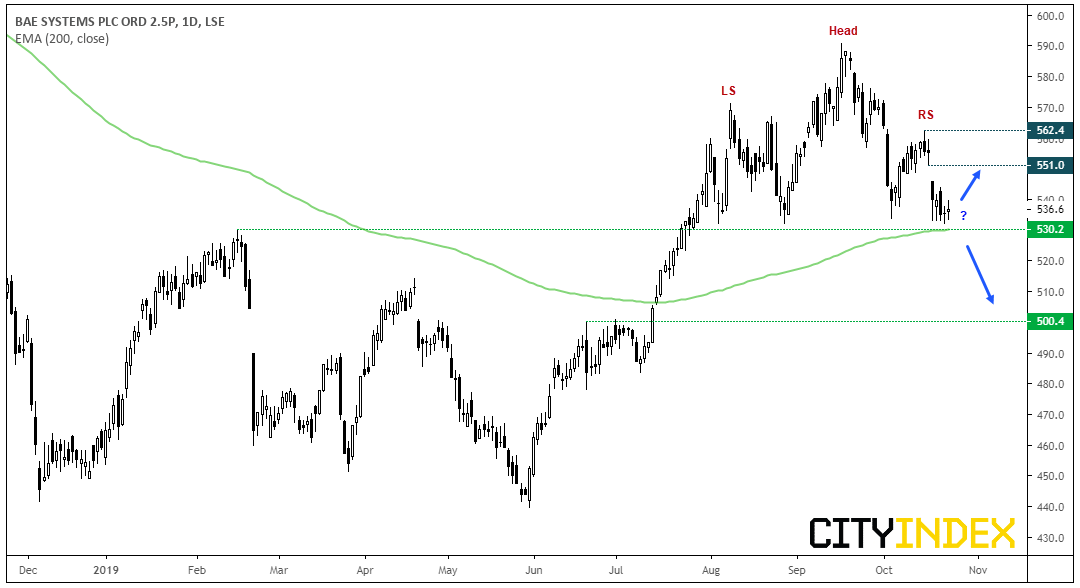
BA Systems CFD/DFT (BA): A potential head and shoulders top is forming, although it’s neckline is just above the 200-day eMA and 530 support. Whilst this means support around 530 could be a tougher nut to crack, it becomes more significant if it does break, or could still provide a bullish setup over the near-term if it bounces instead. Bears could wait for a break below 530 to assume the H&S has been confirmed and target 500, whereas bulls could target the upper gap around 550.
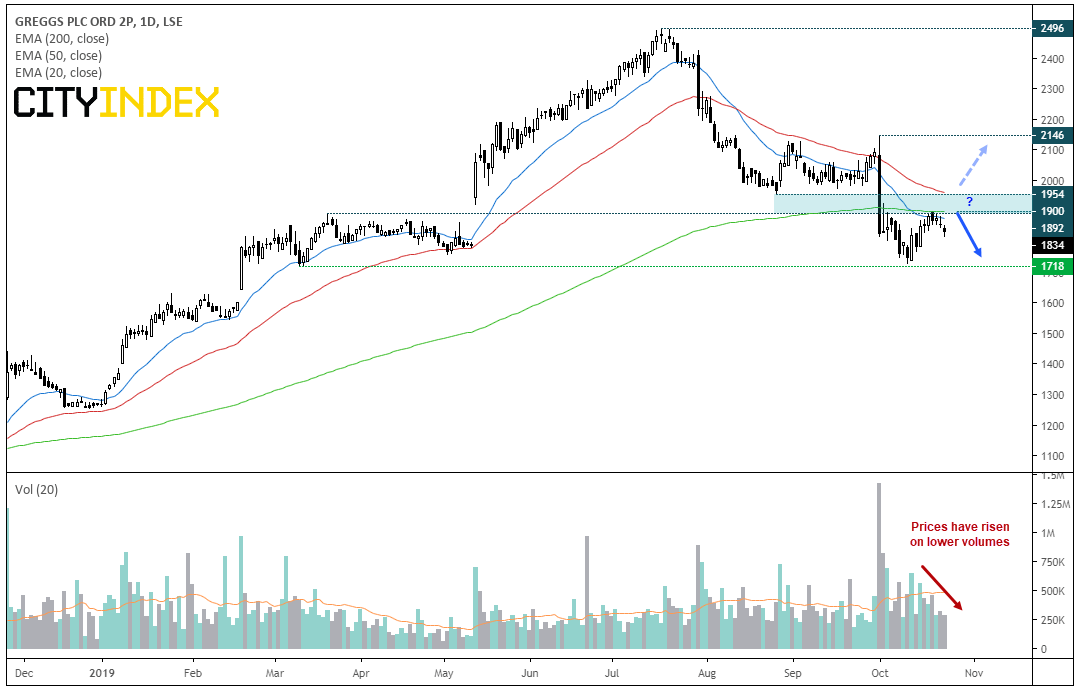
Greggs CFD/DFT (GRG): In some ways, Greggs is similar to the setup on Starbucks we highlighted on Monday. It’s recently broken beneath the 200-day eMA and bounced back towards this level. Indeed, bearish swing traders could look for a move towards the 1718 low whilst prices hold beneath the 1900 area. Also note that the 20 and 50-day eMA’s could cap as dynamic resistance and that the recent ‘rebound’ has been seen in lower volume (meaning it’s more likely corrective). A break below 1718 assumes a run towards 1500.
Bulls may point towards a potential inverted H&S, although we’d want to see prices back above 1954 before assuming the corrective low from the 2496 high is in.
PRICE ACTION UPDATE: FTSE Pauses At Resistance | CWK, CTEC, IMB
Cranswick CFD/DFT: Since breakout out from its 12-month basing pattern, the breakout climbed to a 12-month high. Yet momentum has clearly turned so this on now on the backburner, although we’ll monitor to see if it can build a new level of support above 3116 (breakout level) before reconsidering longs, to target the 3500 high.
Convatec Group PLC CFD/DTF: The break above 188 failed to hold up and by the close produced a key reversal day, back below resistance. This is on the back burner for now but, given its create support around 180 (potential higher low) then we’d reconsider if it were to break back above 191.15
Imperial Brands CFD/DFT: It remains on the watchlist as it’s consolidating after a fall to a new cycle low. Traders could look for a break of 1800 to assume bearish trend continuation. The 1736.2 low is the initial target, although given the strength of the bear trend overall, an eventual break low remains the bias. Alternatively, traders could fade into moves below the 1929.2 gap high – above here bulls would likely look to close the gap up to the 2000 area.
JD Sports Fashion plc CFD/DFT: Trading just off its record highs in a tight flag pattern and found support at its 10-day eMA. It’s one of the stronger performers this year in the FTSE, and daily trend remains bullish above 717.
Segro PLC CFD/DFT: It hit an 11-year high on Tuesday but, if you’re not in, may be time to wait for a retracement given the shooting star on the daily chart. A bullish engulfing candle marks a higher low at 804.6, so we’d like to see a new level of support build above the 800-804 region before reconsidering longs.
Aveva Group plc CFD/DFT: After finally breaking out of its corrective (bearish) channel, prices charged for 4,000 on Tuesday. However, a bearish hammer with a wide body warns of the need for a retracement, so now look for either 3800 to hold as support, or somewhere around a new bullish trendline projected from the September low. Given the longer-term bull trend, it remains firmly on our bullish watchlist.
Related analysis:
S&P500: The Long And Short Of It | Cisco, Welltower, Applied Material
FTSE Pauses At Resistance | CWK, CTEC, IMB
FTSE Looks For A Leg-Up | SGRO, AVV, JD
This report is intended for general circulation only. It should not be construed as a recommendation, or an offer (or solicitation of an offer) to buy or sell any financial products. The information provided does not take into account your specific investment objectives, financial situation or particular needs. Before you act on any recommendation that may be contained in this report, independent advice ought to be sought from a financial adviser regarding the suitability of the investment product, taking into account your specific investment objectives, financial situation or particular needs.
StoneX Financial Pte. Ltd., may distribute reports produced by its respective foreign entities or affiliates within the StoneX group of companies or third parties pursuant to an arrangement under Regulation 32C of the Financial Advisers Regulations. Where the report is distributed to a person in Singapore who is not an accredited investor, expert investor or an institutional investor (as defined in the Securities Futures Act), StoneX Financial Pte. Ltd. accepts legal responsibility to such persons for the contents of the report only to the extent required by law. Singapore recipients should contact StoneX Financial Pte. Ltd. at 6826 9988 for matters arising from, or in connection with the report.
In the case of all other recipients of this report, to the extent permitted by applicable laws and regulations neither StoneX Financial Pte. Ltd. nor its associated companies will be responsible or liable for any loss or damage incurred arising out of, or in connection with, any use of the information contained in this report and all such liability is hereby expressly disclaimed. No representation or warranty is made, express or implied, that the content of this report is complete or accurate.
StoneX Financial Pte. Ltd. is not under any obligation to update this report.
Trading CFDs and FX on margin carries a high level of risk that may not be suitable for some investors. Consider your investment objectives, level of experience, financial resources, risk appetite and other relevant circumstances carefully. The possibility exists that you could lose some or all of your investments, including your initial deposits. If in doubt, please seek independent expert advice. Visit www.cityindex.com/en-sg/terms-and-policies for the complete Risk Disclosure Statement.
ALL TRADING INVOLVES RISKS. LOSSES CAN EXCEED DEPOSITS.
City Index is a trading name of StoneX Financial Pte. Ltd. (“SFP”) for the offering of dealing services in Contracts for Differences (“CFD”). SFP holds a Capital Markets Services Licence issued by the Monetary Authority of Singapore for Dealing in Exchange-Traded Derivatives Contracts, Over-the-Counter Derivatives Contracts, and Spot Foreign Exchange Contracts for the Purposes of Leveraged Foreign Exchange Trading. SFP is also both Derivatives Trading and Clearing member of the Singapore Exchange (“SGX”). SFP is a wholly-owned subsidiary of StoneX Group Inc.
The information provided herein is intended for general circulation. It does not take into account the specific investment objectives, financial situation or particular needs of any particular person. You should take into account your specific investment objectives, financial situation or particular needs before making a commitment to invest, including seeking advice from an independent financial adviser regarding the suitability of the investment, under a separate engagement, as you deem fit. No representation or warranty is given as to the accuracy or completeness of this information. Consequently, any person acting on it does so entirely at their own risk.
The information does not represent an offer of, or solicitation for, a transaction in any investment product. Any views and opinions expressed may be changed without an update. To understand the risks and costs involved, please visit the section captioned “Important Information” and the “Risk Disclosure Statement”.
The information herein is not directed to, or intended for distribution to or use by, any person or entity who is a citizen or resident of or located in any locality, state, country or other jurisdiction where such distribution, publication, availability or use would be contrary to law or regulation.
StoneX Financial Pte. Ltd. 1 Raffles Place, #18-61, One Raffles Place Tower 2, Singapore 048616. Tel: 6309 1000. Co. Reg. No.: 201130598R.
This advertisement has not been reviewed by the Monetary Authority of Singapore.
© City Index 2024