Emerging stock markets bulls at inflection point
iShares MSCI Emerging Markets (EEM) – Losing upside momentum at key resistance
click to enlarge charts
Key Levels (1 to 3 months)
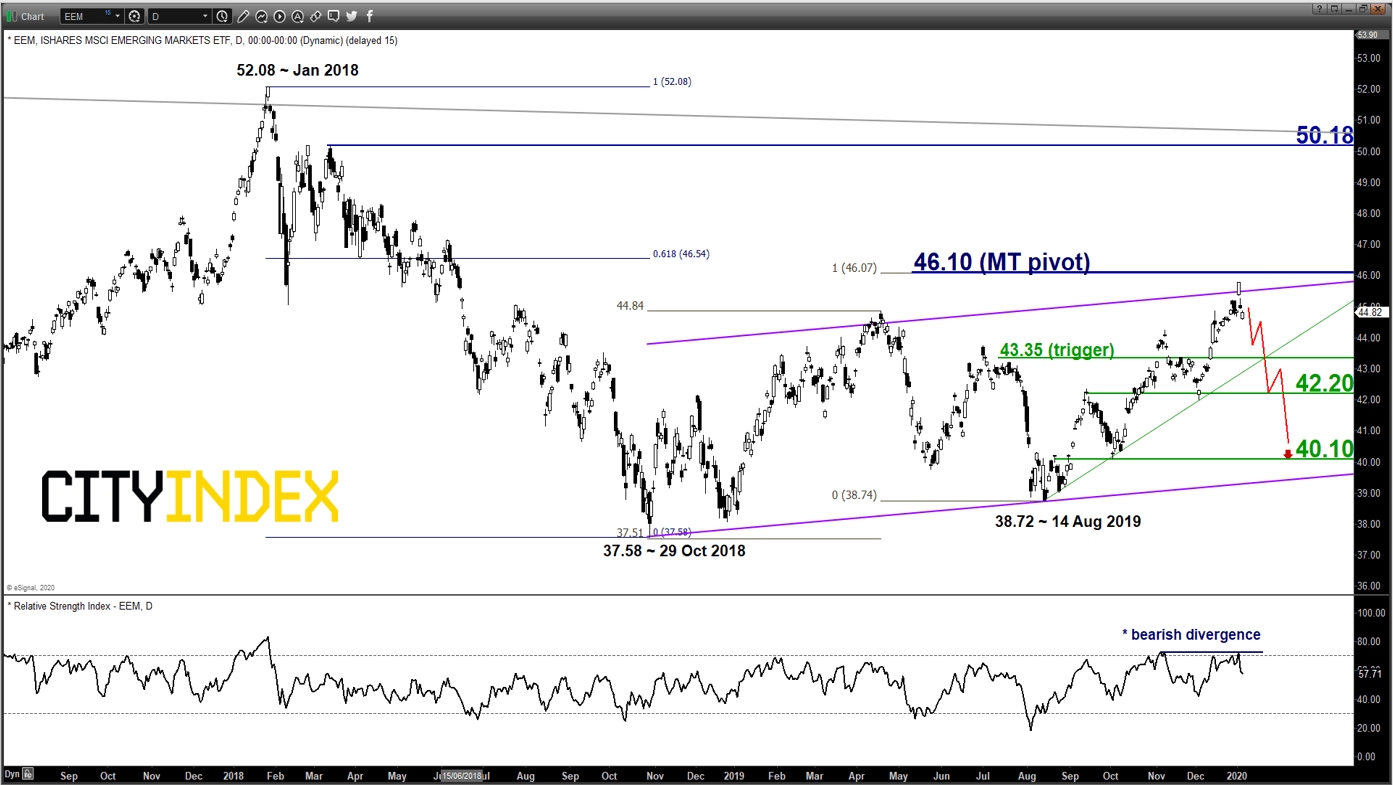
Pivot (key resistance): 46.10
Supports: 43.35, 42.20 & 40.10
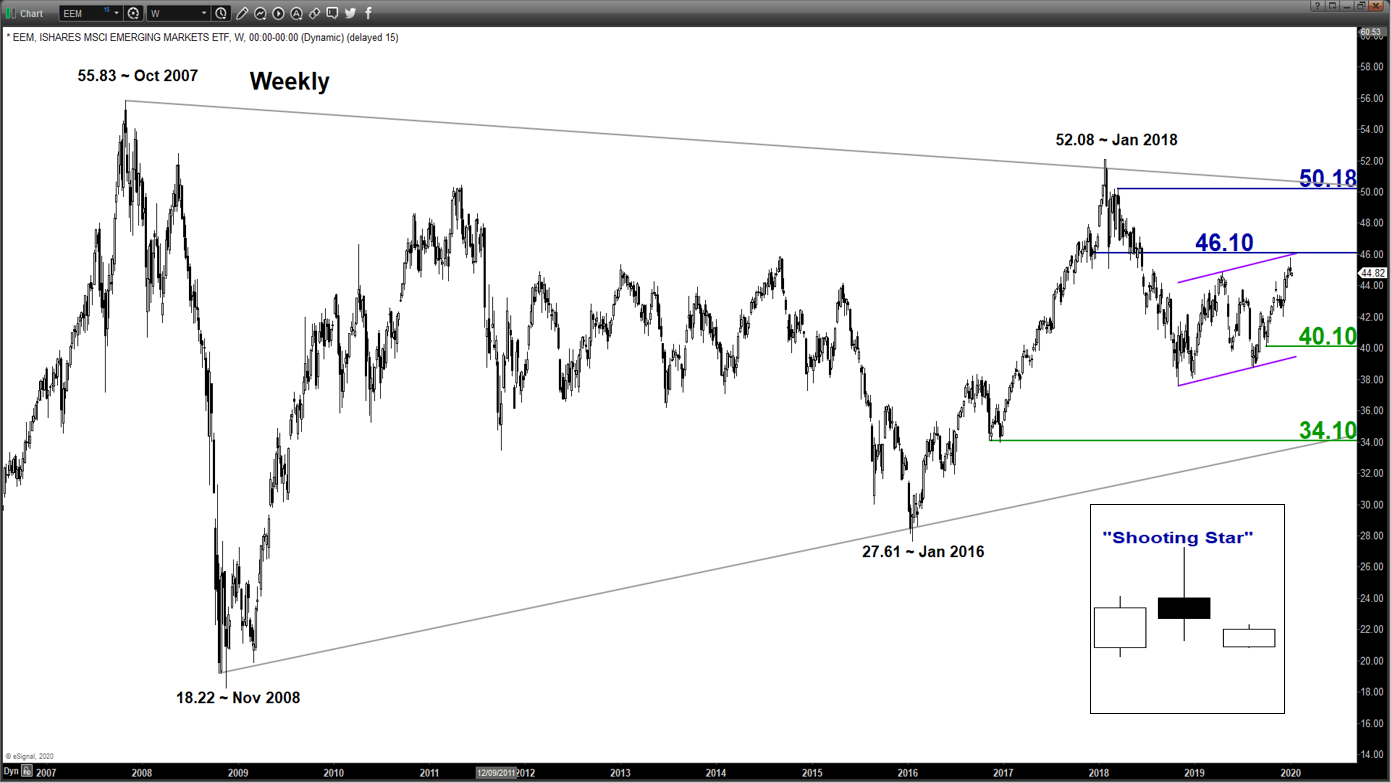
Next resistance: 50.18 (major)
Directional Bias (1 to 3 months)
The share price of EEM has rallied by close to 10% in the month of Dec 2019 to print a high of 45.78 on 02 Jan 2020 reinforced by the de-escalation of trade tension between U.S. and China via the impending agreement of the official Phase One trade deal sign-off on 15 Jan 2020. From its 14 Aug 2019 swing low of 38.72, the EEM has recorded a return of 18%
From a macro environment perspective, the rosy picture has started to turn “greyish” with rising geopolitical risk in the Middle East that has triggered a spike in oil prices. Almost half of major emerging market economies are net oil importers such as India, China, South Africa, thus a runaway rise in oil prices can have adverse effects on these countries’ sovereign balance sheets which in turn lower economic growth prospects.
Bearish bias below 46.10 key medium-term pivotal resistance and a break below 43.35 is likely to reinforce a further potential slide to target the next supports at 42.20 and 40.10 next within a long-term secular “Symmetrical Triangle” range configuration in place since Oct 2007.
On the other hand, a clearance with a daily close above 46.10 invalidates the bearish scenario for a rally towards the major resistance at 50.18 (Fibonacci expansion cluster & upper boundary of the “Symmetrical Triangle”).
Key elements
- The recent rally of the EEM has reached an inflection level of 46.10 which is defined by a medium-term ascending range configuration in place since 29 Oct 2018, the congestion area of 09 Feb/06 June 2018 and a Fibonacci retracement/expansion cluster.
- Price action has formed a weekly bearish “Shooting Star” candlestick pattern coupled with a bearish divergence signal seen in the daily RSI oscillator at its oversold region. These observations suggest that medium-term upside momentum has stated to wane and the risk of a bearish reversal in price action increases at this juncture.
- The 40.10 significant medium-term support is defined by the 76.4% Fibonacci retracement of the recent up move from 14 Aug 2019 low to 02 Jan 2020 high and the lower boundary of the ascending range configuration.
Charts are from eSignal
This report is intended for general circulation only. It should not be construed as a recommendation, or an offer (or solicitation of an offer) to buy or sell any financial products. The information provided does not take into account your specific investment objectives, financial situation or particular needs. Before you act on any recommendation that may be contained in this report, independent advice ought to be sought from a financial adviser regarding the suitability of the investment product, taking into account your specific investment objectives, financial situation or particular needs.
StoneX Financial Pte. Ltd., may distribute reports produced by its respective foreign entities or affiliates within the StoneX group of companies or third parties pursuant to an arrangement under Regulation 32C of the Financial Advisers Regulations. Where the report is distributed to a person in Singapore who is not an accredited investor, expert investor or an institutional investor (as defined in the Securities Futures Act), StoneX Financial Pte. Ltd. accepts legal responsibility to such persons for the contents of the report only to the extent required by law. Singapore recipients should contact StoneX Financial Pte. Ltd. at 6826 9988 for matters arising from, or in connection with the report.
In the case of all other recipients of this report, to the extent permitted by applicable laws and regulations neither StoneX Financial Pte. Ltd. nor its associated companies will be responsible or liable for any loss or damage incurred arising out of, or in connection with, any use of the information contained in this report and all such liability is hereby expressly disclaimed. No representation or warranty is made, express or implied, that the content of this report is complete or accurate.
StoneX Financial Pte. Ltd. is not under any obligation to update this report.
Trading CFDs and FX on margin carries a high level of risk that may not be suitable for some investors. Consider your investment objectives, level of experience, financial resources, risk appetite and other relevant circumstances carefully. The possibility exists that you could lose some or all of your investments, including your initial deposits. If in doubt, please seek independent expert advice. Visit www.cityindex.com/en-sg/terms-and-policies for the complete Risk Disclosure Statement.
ALL TRADING INVOLVES RISKS. LOSSES CAN EXCEED DEPOSITS.
City Index is a trading name of StoneX Financial Pte. Ltd. (“SFP”) for the offering of dealing services in Contracts for Differences (“CFD”). SFP holds a Capital Markets Services Licence issued by the Monetary Authority of Singapore for Dealing in Exchange-Traded Derivatives Contracts, Over-the-Counter Derivatives Contracts, and Spot Foreign Exchange Contracts for the Purposes of Leveraged Foreign Exchange Trading. SFP is also both Derivatives Trading and Clearing member of the Singapore Exchange (“SGX”). SFP is a wholly-owned subsidiary of StoneX Group Inc.
The information provided herein is intended for general circulation. It does not take into account the specific investment objectives, financial situation or particular needs of any particular person. You should take into account your specific investment objectives, financial situation or particular needs before making a commitment to invest, including seeking advice from an independent financial adviser regarding the suitability of the investment, under a separate engagement, as you deem fit. No representation or warranty is given as to the accuracy or completeness of this information. Consequently, any person acting on it does so entirely at their own risk.
The information does not represent an offer of, or solicitation for, a transaction in any investment product. Any views and opinions expressed may be changed without an update. To understand the risks and costs involved, please visit the section captioned “Important Information” and the “Risk Disclosure Statement”.
The information herein is not directed to, or intended for distribution to or use by, any person or entity who is a citizen or resident of or located in any locality, state, country or other jurisdiction where such distribution, publication, availability or use would be contrary to law or regulation.
StoneX Financial Pte. Ltd. 1 Raffles Place, #18-61, One Raffles Place Tower 2, Singapore 048616. Tel: 6309 1000. Co. Reg. No.: 201130598R.
This advertisement has not been reviewed by the Monetary Authority of Singapore.
© City Index 2024