Daily FX Technical Trend Bias Key Levels Tues 23 Apr
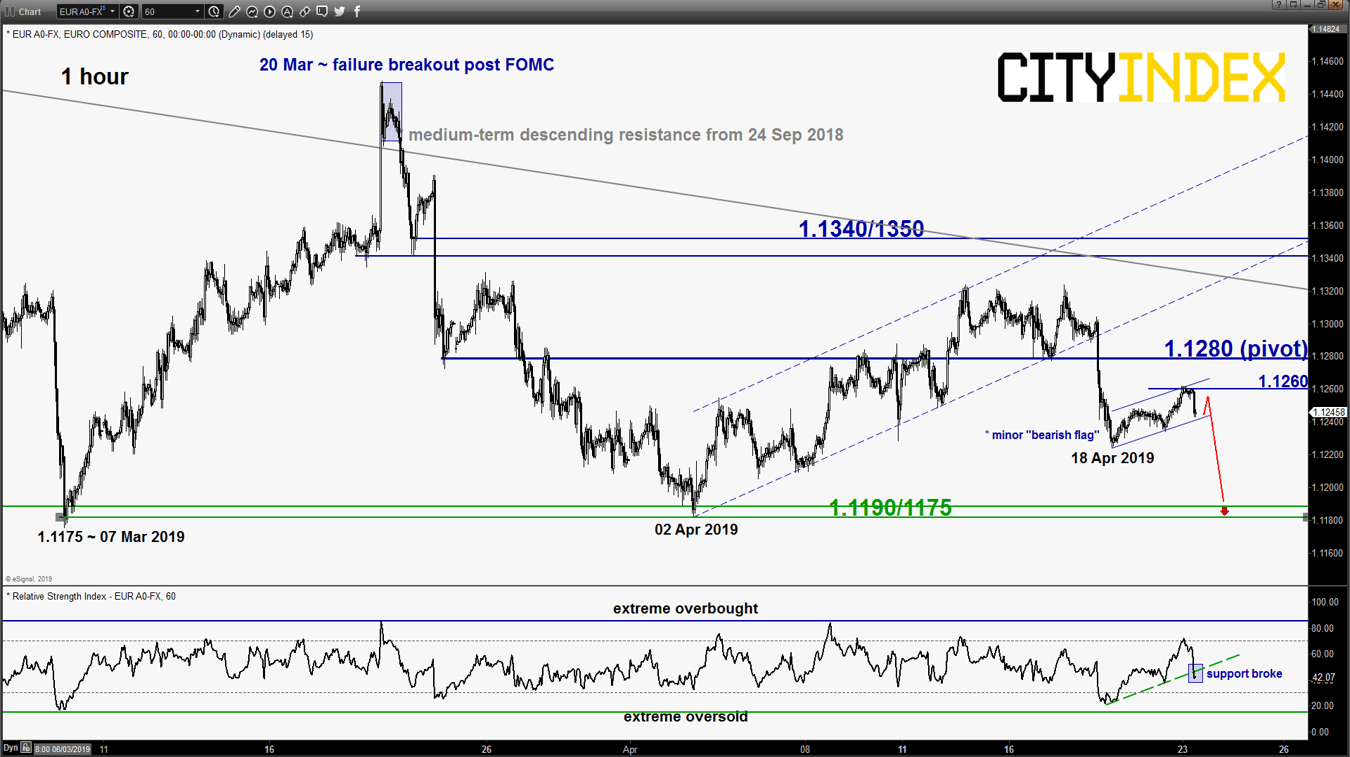
EUR/USD – Push down to retest key medium-term support
click to enlarge chart
- Last Thurs 18 Apr, the pair broke below the 1.1280 short-term pivotal support that invalidated the residual push up scenario as per highlighted in our previous report (click here for a recap).
- Short-term elements have turned bearish where the pair is now evolving within a minor “bearish flag” range consolidation since its 18 Apr 2019 low of 1.1224 to retrace its previous swift push down from 18 Apr 2009 high of 1.1304. In addition, the hourly RSI oscillator has staged a bearish down from a corresponding support at the 45 level (ahead of the parallel price action support of the minor “bearish flag”)
- Flip to a bearish bias in any bounces below the 1.1280 key short-term pivotal resistance for a further potential push down to retest the medium-term range support of 1.1190/1175. However, a clearance above 1.1280 negates the bearish tone for a squeeze up towards 1.1340/1350 (medium-term descending resistance from 24 Sep 2018 high & 61.8% Fibonacci retracement of the previous slide from 20 Mar 2019 high to 02 Apr 2019 low).
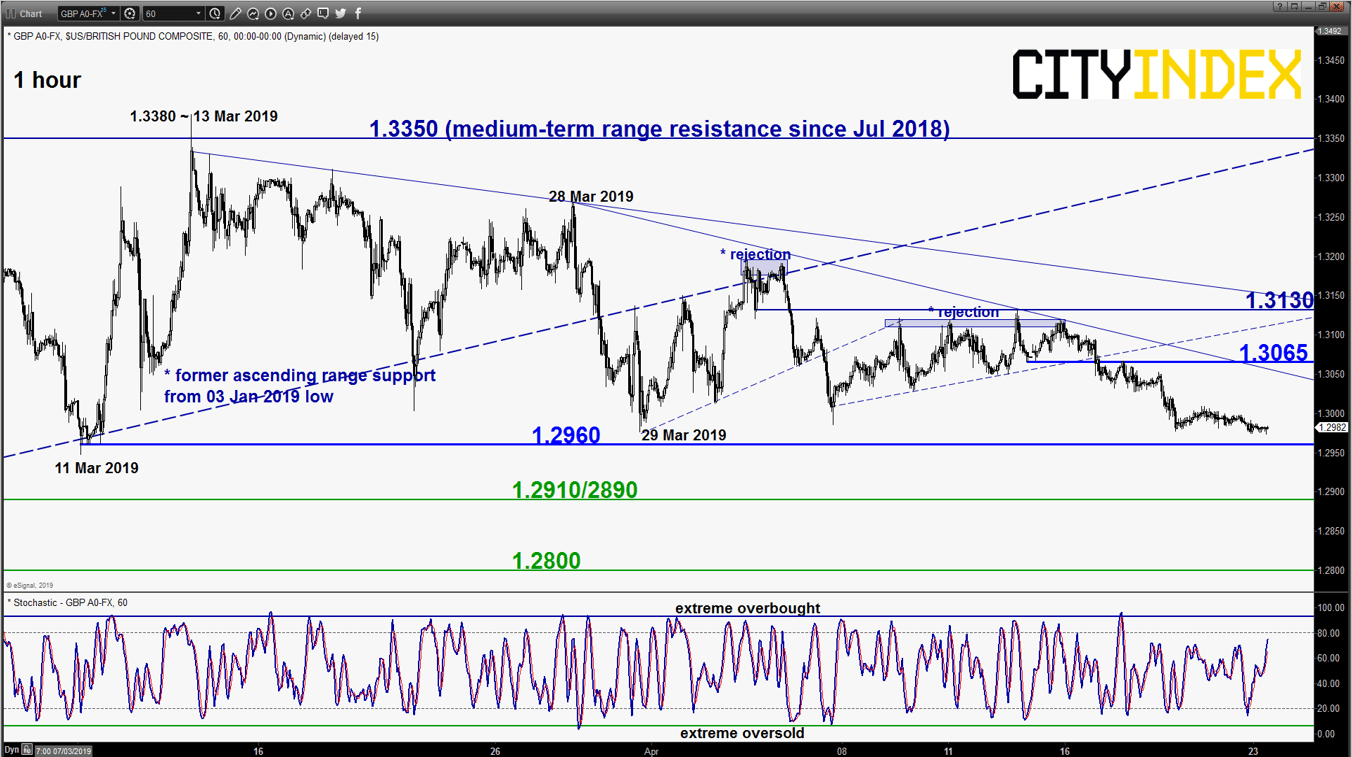
GBP/USD – Mix elements, watch 1.2960 range support
click to enlarge chart
- Drifted down lower as expected and hit the minor range support/target of 1.2980/2960 as per highlighted in our previous report. Mix elements now, prefer to turn neutral between 1.2960 and 1.3065 (minor descending resistance from 28 Mar 2019 high & 61.8% Fibonacci retracement of the latest push down seen from 12 Apr high to 23 Apr current intraday Asian session low of 1.2975). An hourly close below 1.2960 opens up scope for a further slide to target the next near-term supports at 1.2910/2890 follow by 1.2800 (14 Feb 2019 swing low & 61.8% Fibonacci retracement of the up move from 03 Jan 2019 low to 13 Mar 2019 high).
- On the flipside, a break above 1.3065 sees a squeeze up to retest the next intermediate resistance at 1.3130.
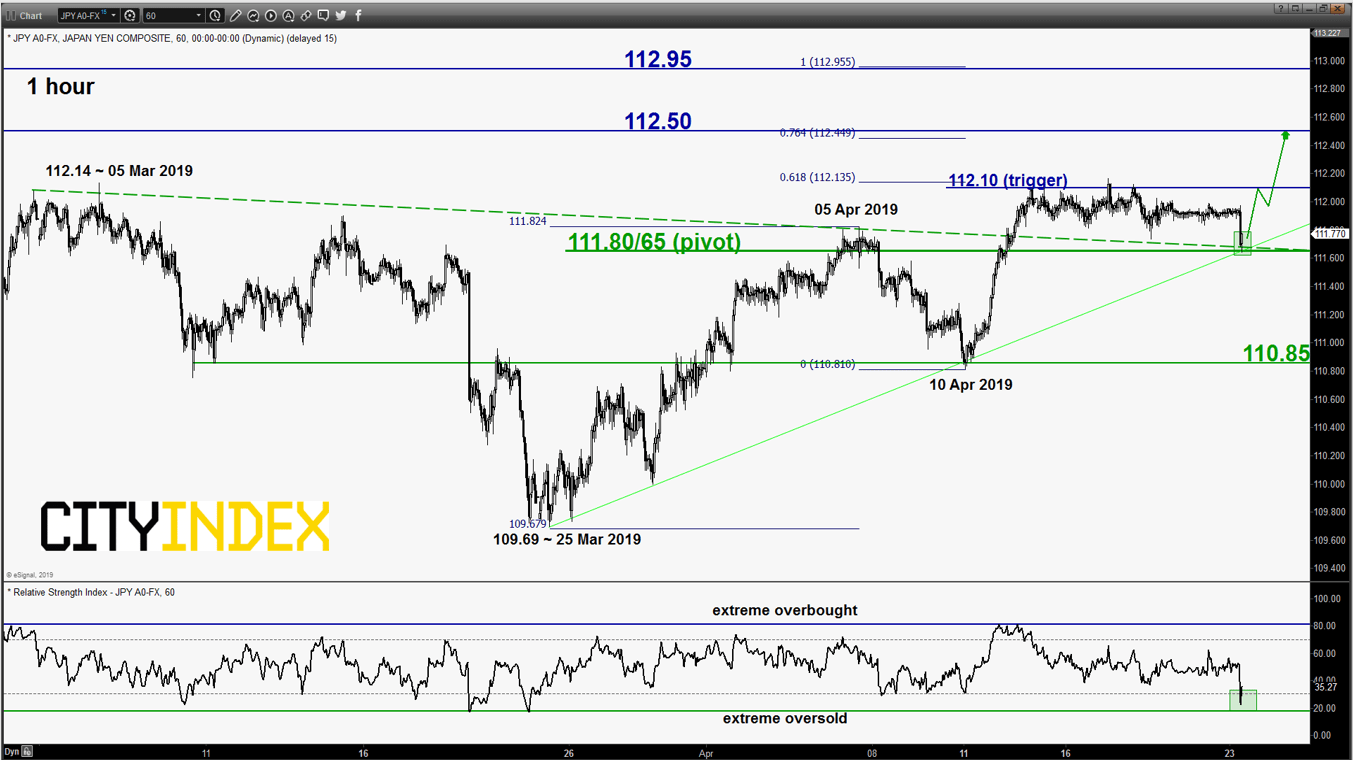
USD/JPY – Tolerate excess to 111.65 for a further potential push up
click to enlarge chart
- Pierced below the 111.80 key short-term pivotal support as per highlighted in our previous report and hit a 5-day low of 111.65 in today, Asian session before it rebounded back towards 111.80 amid the on-going U.S/Iran tensions. Interestingly, the rebound has occurred right at the intersection area of the minor ascending trendline support from 25 Mar 2019 low and the pull-back support of the former descending resistance from 05 Mar 2019. In addition, the hourly RSI oscillator has exited from its oversold region.
- Tolerate the excess and maintain the bullish bias above 111.80/65 key short-term pivotal support and a break above 112.10 reinforces a further potential push up to target the next intermediate resistances at 112.50.
- However, an hourly close below 111.65 negates the bullish tone for another round of slide to retest the 110.85 support.
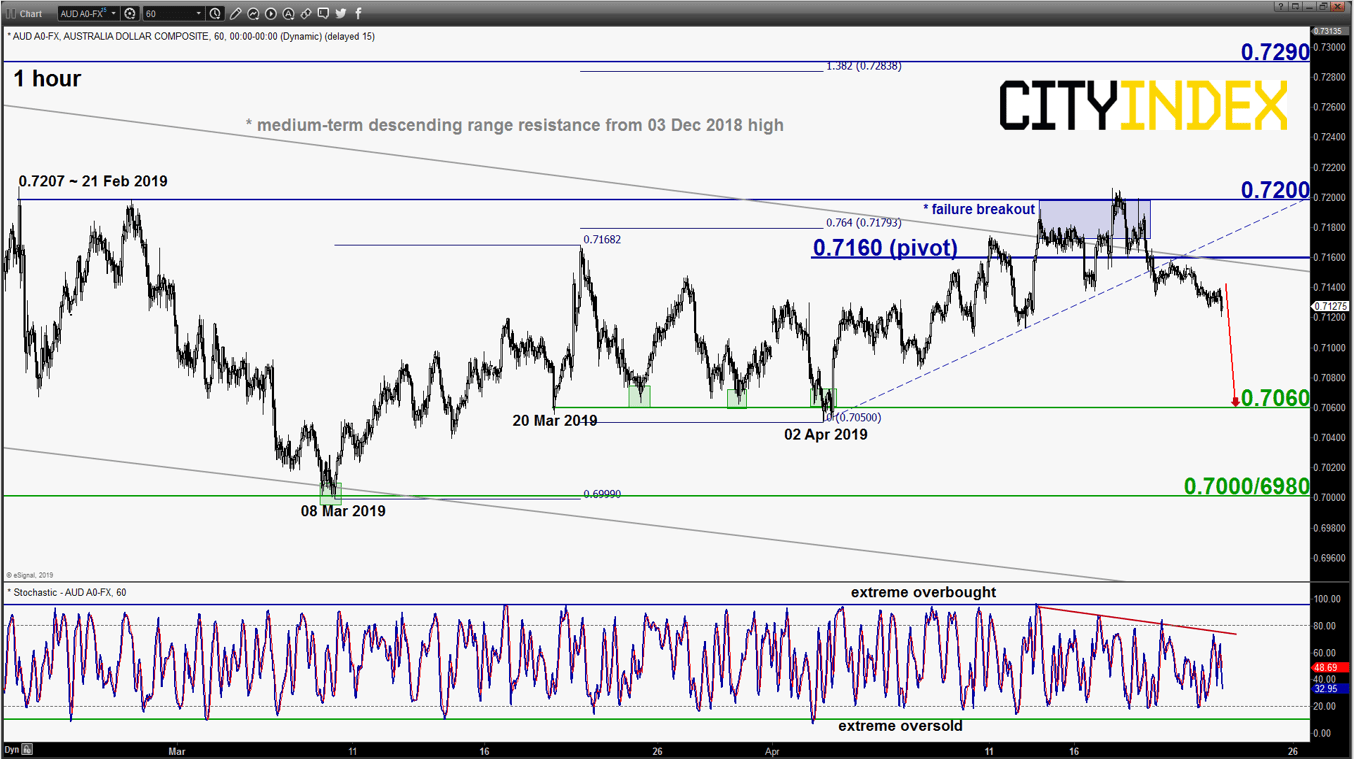
AUD/USD – Further push down within range
click to enlarge chart
- Broke below the 0.7145 lower limit of the short-term neutrality zone as per highlighted in our previous report on last Thurs, 18 Apr that reinstated the push down within range scenario. Flip back to a bearish bias below 0.7160 key short-term pivotal resistance (also the medium-term descending range resistance from 03 Dec 2018 high) for a further potential push down to retest the 0.7060 minor range support in place since 20 Mar 2019.
- However, a break above 0.7160 negates the bearish tone for squeeze up towards 0.7200.
Charts are from eSignal
This report is intended for general circulation only. It should not be construed as a recommendation, or an offer (or solicitation of an offer) to buy or sell any financial products. The information provided does not take into account your specific investment objectives, financial situation or particular needs. Before you act on any recommendation that may be contained in this report, independent advice ought to be sought from a financial adviser regarding the suitability of the investment product, taking into account your specific investment objectives, financial situation or particular needs.
StoneX Financial Pte. Ltd., may distribute reports produced by its respective foreign entities or affiliates within the StoneX group of companies or third parties pursuant to an arrangement under Regulation 32C of the Financial Advisers Regulations. Where the report is distributed to a person in Singapore who is not an accredited investor, expert investor or an institutional investor (as defined in the Securities Futures Act), StoneX Financial Pte. Ltd. accepts legal responsibility to such persons for the contents of the report only to the extent required by law. Singapore recipients should contact StoneX Financial Pte. Ltd. at 6826 9988 for matters arising from, or in connection with the report.
In the case of all other recipients of this report, to the extent permitted by applicable laws and regulations neither StoneX Financial Pte. Ltd. nor its associated companies will be responsible or liable for any loss or damage incurred arising out of, or in connection with, any use of the information contained in this report and all such liability is hereby expressly disclaimed. No representation or warranty is made, express or implied, that the content of this report is complete or accurate.
StoneX Financial Pte. Ltd. is not under any obligation to update this report.
Trading CFDs and FX on margin carries a high level of risk that may not be suitable for some investors. Consider your investment objectives, level of experience, financial resources, risk appetite and other relevant circumstances carefully. The possibility exists that you could lose some or all of your investments, including your initial deposits. If in doubt, please seek independent expert advice. Visit www.cityindex.com/en-sg/terms-and-policies for the complete Risk Disclosure Statement.
ALL TRADING INVOLVES RISKS. LOSSES CAN EXCEED DEPOSITS.
City Index is a trading name of StoneX Financial Pte. Ltd. (“SFP”) for the offering of dealing services in Contracts for Differences (“CFD”). SFP holds a Capital Markets Services Licence issued by the Monetary Authority of Singapore for Dealing in Exchange-Traded Derivatives Contracts, Over-the-Counter Derivatives Contracts, and Spot Foreign Exchange Contracts for the Purposes of Leveraged Foreign Exchange Trading. SFP is also both Derivatives Trading and Clearing member of the Singapore Exchange (“SGX”). SFP is a wholly-owned subsidiary of StoneX Group Inc.
The information provided herein is intended for general circulation. It does not take into account the specific investment objectives, financial situation or particular needs of any particular person. You should take into account your specific investment objectives, financial situation or particular needs before making a commitment to invest, including seeking advice from an independent financial adviser regarding the suitability of the investment, under a separate engagement, as you deem fit. No representation or warranty is given as to the accuracy or completeness of this information. Consequently, any person acting on it does so entirely at their own risk.
The information does not represent an offer of, or solicitation for, a transaction in any investment product. Any views and opinions expressed may be changed without an update. To understand the risks and costs involved, please visit the section captioned “Important Information” and the “Risk Disclosure Statement”.
The information herein is not directed to, or intended for distribution to or use by, any person or entity who is a citizen or resident of or located in any locality, state, country or other jurisdiction where such distribution, publication, availability or use would be contrary to law or regulation.
StoneX Financial Pte. Ltd. 1 Raffles Place, #18-61, One Raffles Place Tower 2, Singapore 048616. Tel: 6309 1000. Co. Reg. No.: 201130598R.
This advertisement has not been reviewed by the Monetary Authority of Singapore.
© City Index 2024