Can Microsoft earnings revive the bulls
After the U.S. stock market closes today, bellwether index component stock; Microsoft Corp will report its Q1 2020 earnings where it is ranked first and second in terms of market capitalisation in the S&P 500 and Nasdaq 100 respectively. My colleague, Ken Odeluga has written an earnings preview report on Microsoft and other major U.S. technology firms (click here for a recap).
Let’s us now take a look at the share price of Microsoft from a technical analysis perspective.
Medium-term technical outlook of Microsoft (MSFT)
click to enlarge charts
Key Levels (1 to 3 weeks)
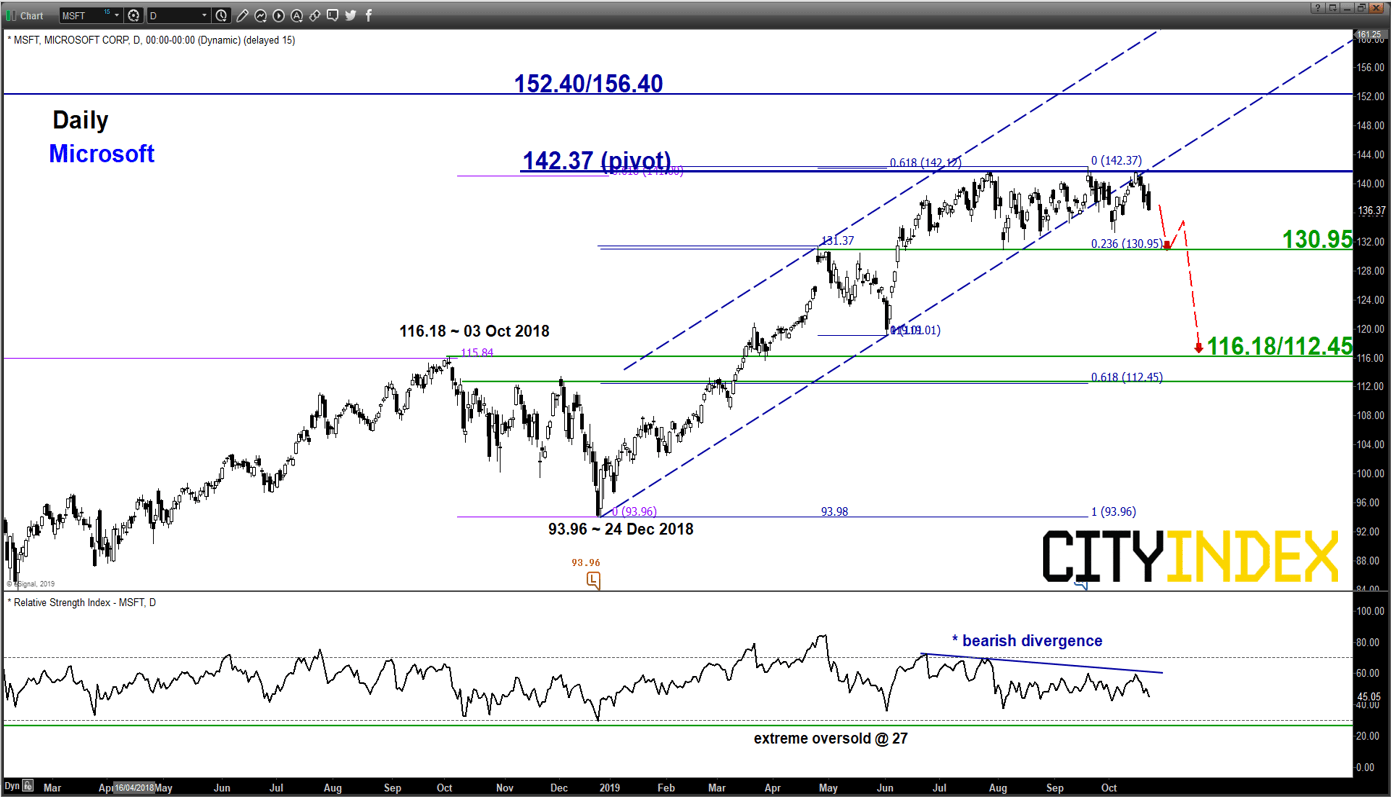
Pivot (key resistance): 142.37
Supports: 130.95 & 116.18/112.45
Next resistance: 152.40/154.40
Directional Bias (1 to 3 weeks)
At risk of shaping a multi-week corrective decline within a longer-term primary uptrend below its current all-time high of 142.37 and a break below 130.95 (trigger level) reinforces a further potential down move to target the next medium-term support zone at 116.18/112.45.
On the other hand, a clearance with a daily close above 142.37 invalidates the corrective decline scenario for a continuation of the impulsive upleg sequence towards the next resistance zone of 152.40/156.40 (upper boundary of long-term primary ascending channel from 24 Aug 2015 low & Fibonacci expansion cluster).
Key elements
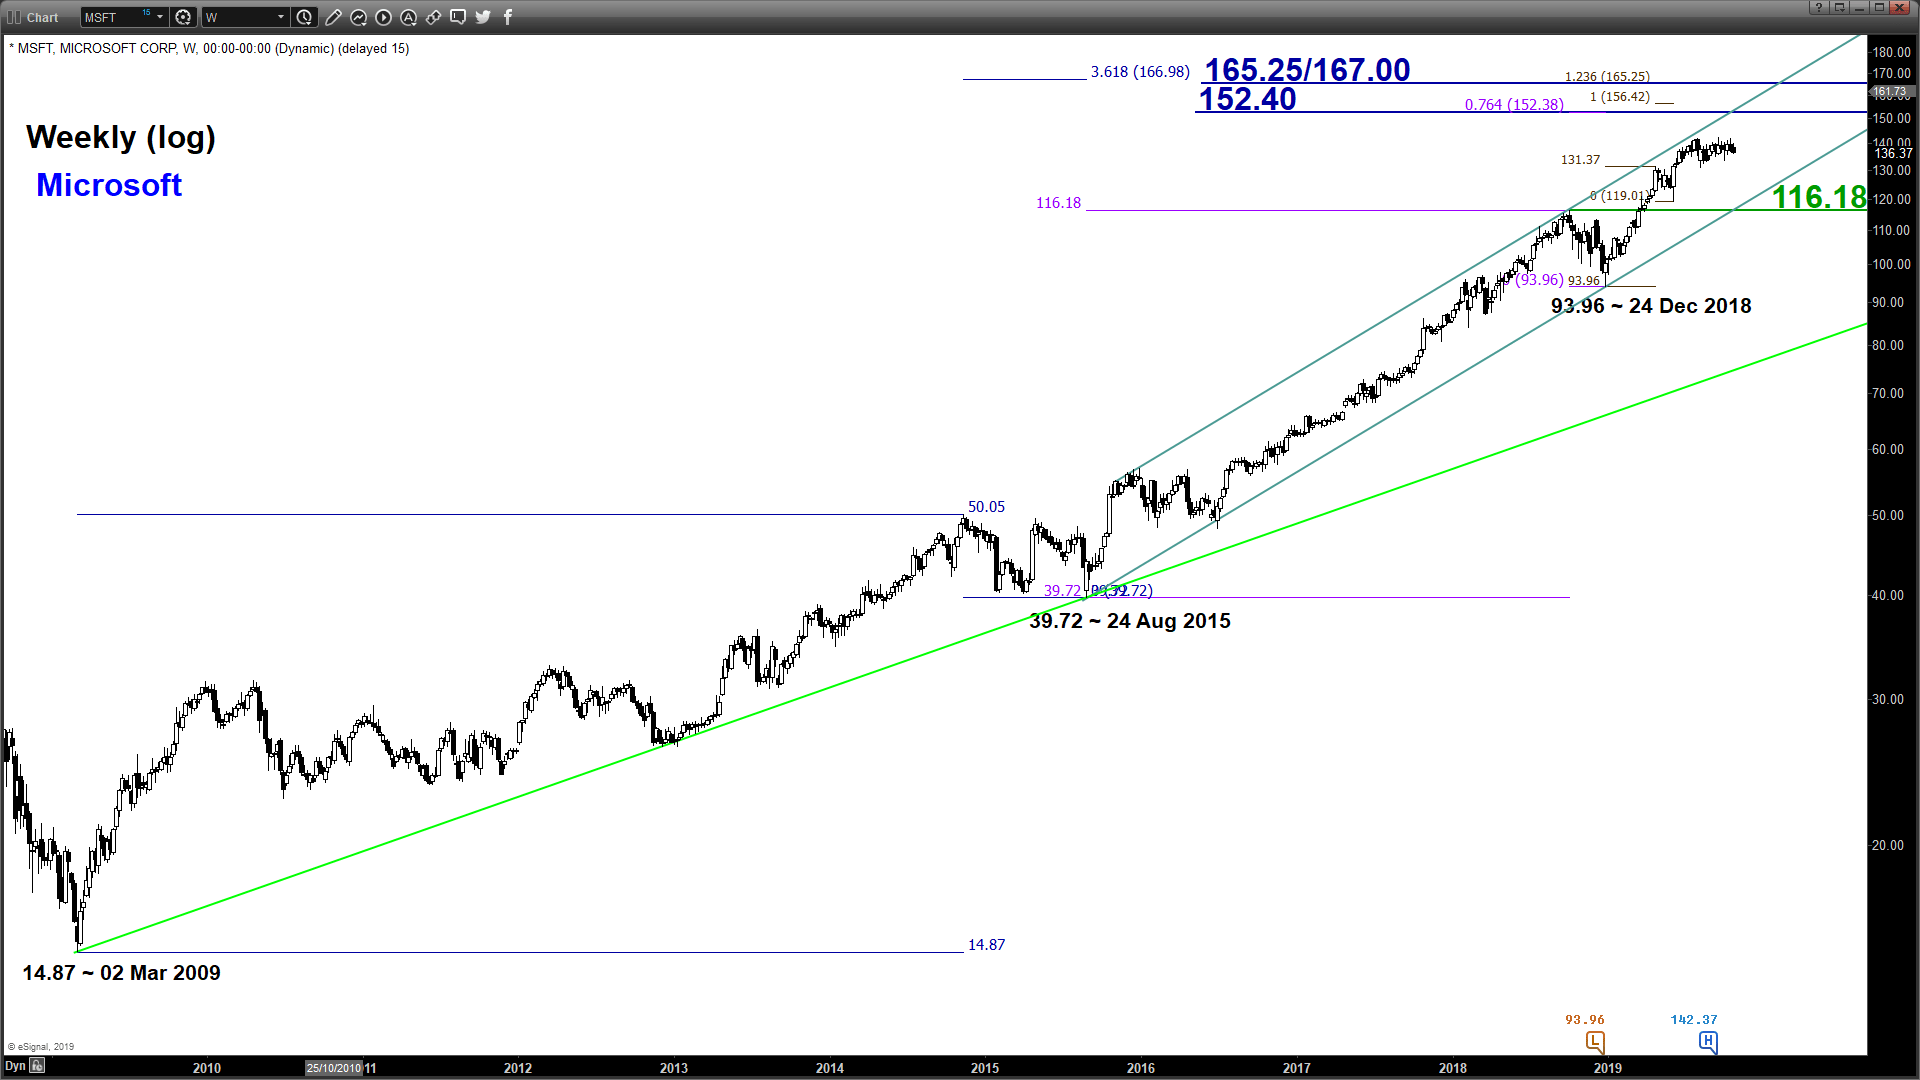
- MSFT has broken below a major ascending channel support in place since 24 Dec 2018 low of 93.96 on 01 Oct 2019 and drifted down lower to print a low of 133.22 on 03 Oct 2019. Thereafter, it staged a rebound of 6.4% to retest the pull-back resistance of the former ascending channel support as well as the 142.37 current all-time time level on 15 Oct 2019 where it printed an intraday high of 141.79.
- Thereafter, it has shed -3.9% to print a low of 136.26 in yesterday, 22 Oct U.S. session with upside momentum that has continued to wane. The daily RSI oscillator has posted a bearish divergence signal in place since 24 Jun 2019 while price action of MSFT traced out “similar highs”.
- The 130.95 downside trigger level is defined by the 05 Aug 2019 swing low area (the lowest point of the sideways range formed from 05 Aug to 15 Oct 2019) and the 23.6% Fibonacci retracement of the up move from 24 Dec 2018 low to 19 Sep 2019 current all-time high.
- The significant medium-term support zone of 116.18/112.45 is defined by the 61.8% Fibonacci retracement of the up move from 24 Dec 2018 low to 19 Sep 2019 current all-time high and the lower boundary of the long-term primary ascending channel from 24 Aug 2015 low).
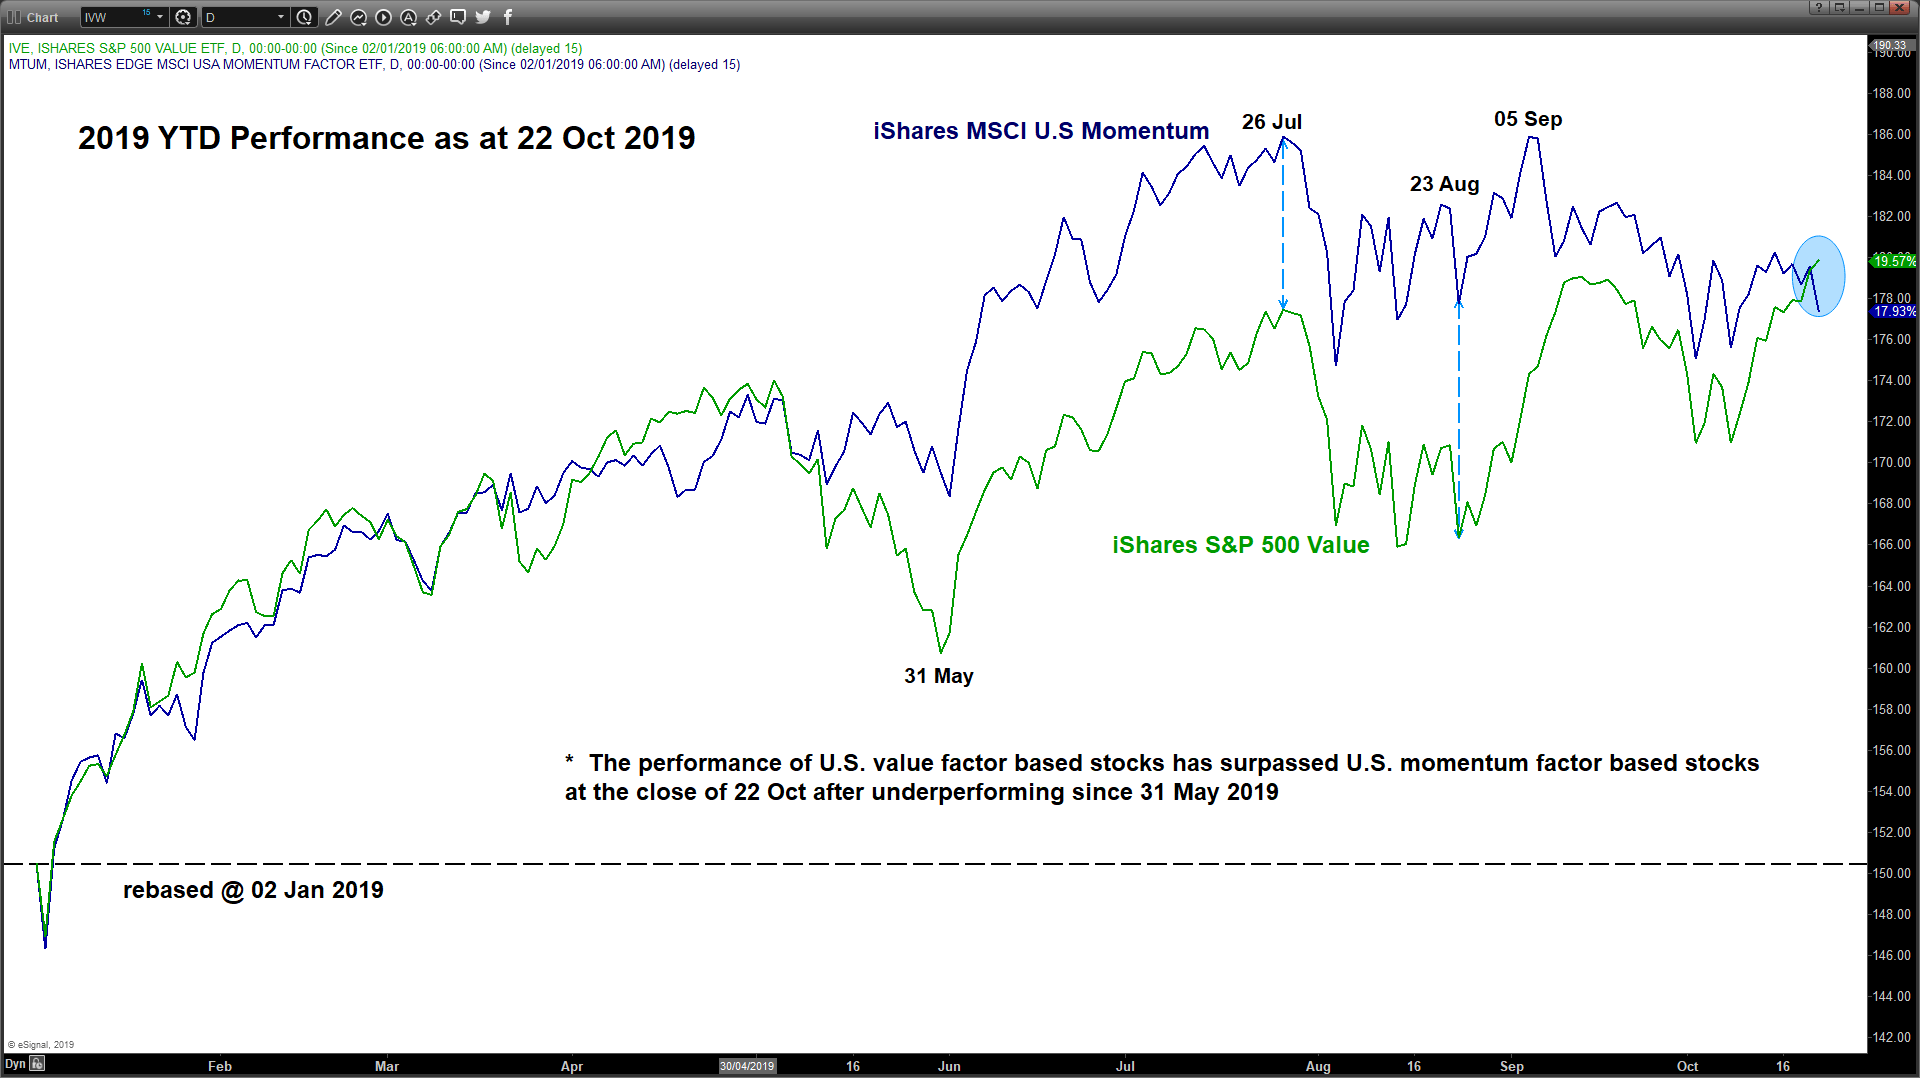
- After the close of yesterday U.S. session based on iShares indices ETFs, value factor-based U.S. stocks (IVE) have outperformed momentum factor-based U.S. stocks (MTUM) for the first time since 31 May 2019 after considering their respective 2019 year to date performances. Microsoft Corp is the 3rd largest component stock in the MSCI USA Momentum Factor Index ETF (MTUM) where a further potential decline in MSFT may see a further widening of outperformance in IVE against MTUM (refer to the last chart).
- Thus, there seems to a significant rotation into value-oriented stocks such as financials, consumer staples and even energy related stocks where these previous laggards may take up a leadership role in the U.S. stock market over the medium-term.
Charts are from eSignal
This report is intended for general circulation only. It should not be construed as a recommendation, or an offer (or solicitation of an offer) to buy or sell any financial products. The information provided does not take into account your specific investment objectives, financial situation or particular needs. Before you act on any recommendation that may be contained in this report, independent advice ought to be sought from a financial adviser regarding the suitability of the investment product, taking into account your specific investment objectives, financial situation or particular needs.
StoneX Financial Pte. Ltd., may distribute reports produced by its respective foreign entities or affiliates within the StoneX group of companies or third parties pursuant to an arrangement under Regulation 32C of the Financial Advisers Regulations. Where the report is distributed to a person in Singapore who is not an accredited investor, expert investor or an institutional investor (as defined in the Securities Futures Act), StoneX Financial Pte. Ltd. accepts legal responsibility to such persons for the contents of the report only to the extent required by law. Singapore recipients should contact StoneX Financial Pte. Ltd. at 6826 9988 for matters arising from, or in connection with the report.
In the case of all other recipients of this report, to the extent permitted by applicable laws and regulations neither StoneX Financial Pte. Ltd. nor its associated companies will be responsible or liable for any loss or damage incurred arising out of, or in connection with, any use of the information contained in this report and all such liability is hereby expressly disclaimed. No representation or warranty is made, express or implied, that the content of this report is complete or accurate.
StoneX Financial Pte. Ltd. is not under any obligation to update this report.
Trading CFDs and FX on margin carries a high level of risk that may not be suitable for some investors. Consider your investment objectives, level of experience, financial resources, risk appetite and other relevant circumstances carefully. The possibility exists that you could lose some or all of your investments, including your initial deposits. If in doubt, please seek independent expert advice. Visit www.cityindex.com/en-sg/terms-and-policies for the complete Risk Disclosure Statement.
ALL TRADING INVOLVES RISKS. LOSSES CAN EXCEED DEPOSITS.
City Index is a trading name of StoneX Financial Pte. Ltd. (“SFP”) for the offering of dealing services in Contracts for Differences (“CFD”). SFP holds a Capital Markets Services Licence issued by the Monetary Authority of Singapore for Dealing in Exchange-Traded Derivatives Contracts, Over-the-Counter Derivatives Contracts, and Spot Foreign Exchange Contracts for the Purposes of Leveraged Foreign Exchange Trading. SFP is also both Derivatives Trading and Clearing member of the Singapore Exchange (“SGX”). SFP is a wholly-owned subsidiary of StoneX Group Inc.
The information provided herein is intended for general circulation. It does not take into account the specific investment objectives, financial situation or particular needs of any particular person. You should take into account your specific investment objectives, financial situation or particular needs before making a commitment to invest, including seeking advice from an independent financial adviser regarding the suitability of the investment, under a separate engagement, as you deem fit. No representation or warranty is given as to the accuracy or completeness of this information. Consequently, any person acting on it does so entirely at their own risk.
The information does not represent an offer of, or solicitation for, a transaction in any investment product. Any views and opinions expressed may be changed without an update. To understand the risks and costs involved, please visit the section captioned “Important Information” and the “Risk Disclosure Statement”.
The information herein is not directed to, or intended for distribution to or use by, any person or entity who is a citizen or resident of or located in any locality, state, country or other jurisdiction where such distribution, publication, availability or use would be contrary to law or regulation.
StoneX Financial Pte. Ltd. 1 Raffles Place, #18-61, One Raffles Place Tower 2, Singapore 048616. Tel: 6309 1000. Co. Reg. No.: 201130598R.
This advertisement has not been reviewed by the Monetary Authority of Singapore.
© City Index 2024