Can Google Alphabet break new high on the third attempt
Alphabet Inc, the holding company of Google will report its Q3 2019 earnings on Mon, 28 Oct after the close of the U.S. session. Consensus adjusted EPS and revenue forecasts are pegged at $14.59 and $23.72bn respectively. My colleague, Ken Odeluga has written an earnings preview report earlier (click here for a recap).
We will now decipher the share price of Alphabet from a technical analysis perspective.
Medium-term technical outlook on Alphabet (GOOGL)
click to enlarge charts
Key Levels (1 to 3 weeks)
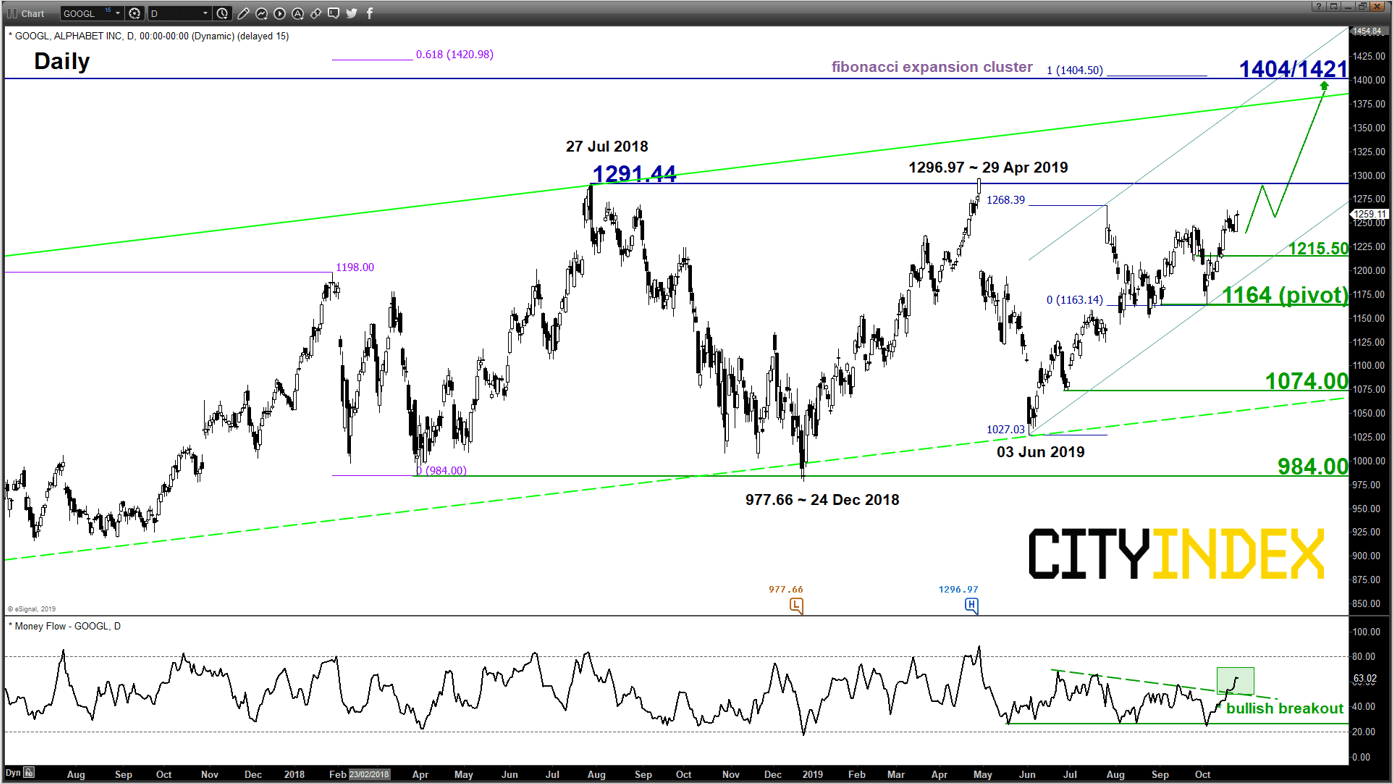
Intermediate support: 1215.50
Pivot (key support): 1164
Resistances: 1291.44 & 1404/1421
Next support: 1074
Directional Bias (1 to 3 weeks)
Bullish bias in any dips above 1164 key medium-term pivotal support and a clearance above 1291.44 is likely to open up scope for another potential impulsive upleg sequence to target the next significant major resistance zone at 1404/1421.
On the other hand, a break with a daily close below 1164 put the bullish tone on hold for a corrective slide to retest the upper limit of a major support zone at 1074.00 (the median line of a long-term secular ascending channel from Aug 2004 low & 76.4% Fibonacci retracement of the up move from 03 Jun low to 26 Jul 2019 high.
Key elements
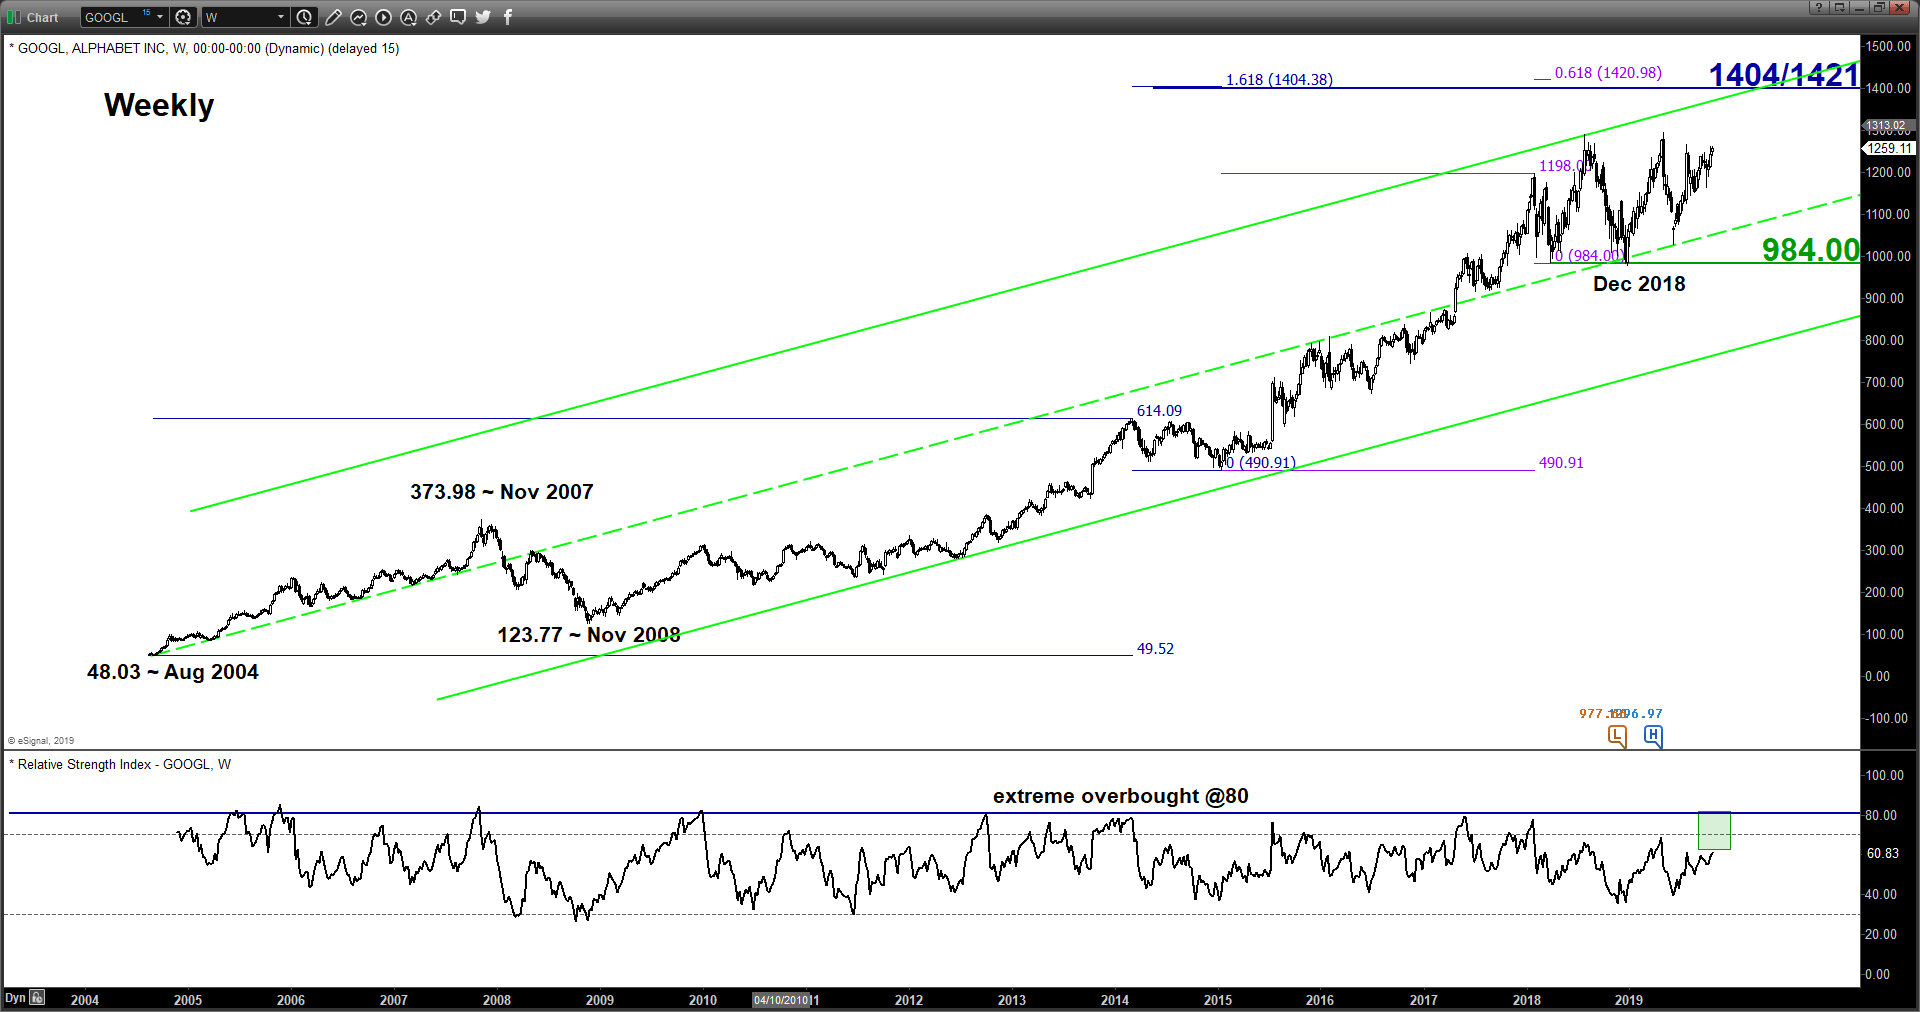
- The weekly RSI oscillator has continued to inch upwards since Jun 2019 and still has room to manoeuvre to the upside before it reaches an extreme overbought level at 80.
- The daily Money Flow Index (MFI) has staged a bullish breakout and has not reached its overbought region where its measurement is derived from a combination of price action and volume. Thus, observations from RSI and MFI suggest that both volume and upside momentum has started to pick up which supports a potential bullish breakout from its 15-month range configuration in place since 27 Jul 2018.
- Relative strength analysis against the market (S&P) and its sector (Communication Services) as infer from the ratio charts (refer to the last chart) are suggesting potential outperformance of Google/Alphabet against its Communication Services sector.
- The major resistance zone of 1404/1421 is defined by the upper boundary of the long-term secular ascending channel that confluences with upper boundary of the medium-term ascending channel from 03 Jun 2019 low and a Fibonacci expansion cluster.
Charts are from eSignal
This report is intended for general circulation only. It should not be construed as a recommendation, or an offer (or solicitation of an offer) to buy or sell any financial products. The information provided does not take into account your specific investment objectives, financial situation or particular needs. Before you act on any recommendation that may be contained in this report, independent advice ought to be sought from a financial adviser regarding the suitability of the investment product, taking into account your specific investment objectives, financial situation or particular needs.
StoneX Financial Pte. Ltd., may distribute reports produced by its respective foreign entities or affiliates within the StoneX group of companies or third parties pursuant to an arrangement under Regulation 32C of the Financial Advisers Regulations. Where the report is distributed to a person in Singapore who is not an accredited investor, expert investor or an institutional investor (as defined in the Securities Futures Act), StoneX Financial Pte. Ltd. accepts legal responsibility to such persons for the contents of the report only to the extent required by law. Singapore recipients should contact StoneX Financial Pte. Ltd. at 6826 9988 for matters arising from, or in connection with the report.
In the case of all other recipients of this report, to the extent permitted by applicable laws and regulations neither StoneX Financial Pte. Ltd. nor its associated companies will be responsible or liable for any loss or damage incurred arising out of, or in connection with, any use of the information contained in this report and all such liability is hereby expressly disclaimed. No representation or warranty is made, express or implied, that the content of this report is complete or accurate.
StoneX Financial Pte. Ltd. is not under any obligation to update this report.
Trading CFDs and FX on margin carries a high level of risk that may not be suitable for some investors. Consider your investment objectives, level of experience, financial resources, risk appetite and other relevant circumstances carefully. The possibility exists that you could lose some or all of your investments, including your initial deposits. If in doubt, please seek independent expert advice. Visit www.cityindex.com/en-sg/terms-and-policies for the complete Risk Disclosure Statement.
ALL TRADING INVOLVES RISKS. LOSSES CAN EXCEED DEPOSITS.
City Index is a trading name of StoneX Financial Pte. Ltd. (“SFP”) for the offering of dealing services in Contracts for Differences (“CFD”). SFP holds a Capital Markets Services Licence issued by the Monetary Authority of Singapore for Dealing in Exchange-Traded Derivatives Contracts, Over-the-Counter Derivatives Contracts, and Spot Foreign Exchange Contracts for the Purposes of Leveraged Foreign Exchange Trading. SFP is also both Derivatives Trading and Clearing member of the Singapore Exchange (“SGX”). SFP is a wholly-owned subsidiary of StoneX Group Inc.
The information provided herein is intended for general circulation. It does not take into account the specific investment objectives, financial situation or particular needs of any particular person. You should take into account your specific investment objectives, financial situation or particular needs before making a commitment to invest, including seeking advice from an independent financial adviser regarding the suitability of the investment, under a separate engagement, as you deem fit. No representation or warranty is given as to the accuracy or completeness of this information. Consequently, any person acting on it does so entirely at their own risk.
The information does not represent an offer of, or solicitation for, a transaction in any investment product. Any views and opinions expressed may be changed without an update. To understand the risks and costs involved, please visit the section captioned “Important Information” and the “Risk Disclosure Statement”.
The information herein is not directed to, or intended for distribution to or use by, any person or entity who is a citizen or resident of or located in any locality, state, country or other jurisdiction where such distribution, publication, availability or use would be contrary to law or regulation.
StoneX Financial Pte. Ltd. 1 Raffles Place, #18-61, One Raffles Place Tower 2, Singapore 048616. Tel: 6309 1000. Co. Reg. No.: 201130598R.
This advertisement has not been reviewed by the Monetary Authority of Singapore.
© City Index 2024