BOJ Preview Expectations Forward Returns And Some Charts
With action finally expected from BOJ, it should create volatility for traders regardless of whether they act or not. BOJ surprised markets on the 29th January 2016 by going into negative rates of -0.1, a move that was designed to achieve 2% inflation “at the earliest possible time”. Well, 3 years and 9 months later, core CPI hasn’t been anywhere near 2% and is now just 0.5% YoY.
Going off headlines earlier this month, expectations for BOJ to go further into negative territory tomorrow had been on the rise. Yet optimism of trade talks between US and China may remove the immediate argument for action, although it remains apparent that BOJ have been laying the groundwork for some action.
Just some of Kuroda’s comments in October (newest to oldest)
- BOJ will ease if needed, it still has room to do so
- BOJ still has room to top up stimulus but what steps it takes will depend on decisions at each meeting
- Risks to economy are tilted to the downside
- No need to rule out any policy option, including deepening of negative rates
- BOJ has become more keen to ease than before as risks to economy heighten
- BOJ can combine, enhance tools which are rate cuts, increase asset buying and acceleration of base money
- If oil prices continue to fall and clearly push down Japan’s inflation, that could affect inflation expectations
Considering that (the lack of) inflation expectations were a key reason as to why BOJ went into negative rate sin the first place, then oil prices inflation expectations could be the easiest guide to decipher whether they’ll go further into negative territory and how far. Yet whilst there are multiple mentions of cutting rates, he does also speak about further stimulus. So as per usual, BOJ are keeping markets on their toes despite their vow to be more open with any forward guidance. Taking the above into account, BOJ appears set to do something tomorrow, even if it means just spelling out what they’ll do at a later meeting.
This could include:
- Expanding the monetary base / Purchasing more ETF’s
- Adjusting their YCC (yield curve control)
- Going further into negative rates (probably by another -10 bps to -0.2%)
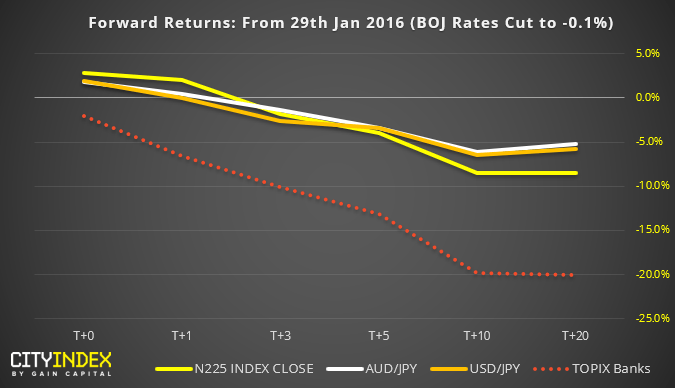
How did markets fare when BOJ went into negative rates?
- Demand for JPY as a safe haven was apparent, seeing USD/JPY and AUD/JPY depreciate 5% over the next 20 days. That said, both markets traded higher on the day of the announcement.
- The banking sector, whose profits are directly influenced by interest rates declined 20% just 20 days after BOJ went to -0.1% It also closed lower on the day negative rates were announced.
- The Nikkei 225 (Japan 225 CFD/DFT) also reacted positively on T+0 to T+1, before declining -0.85% by T+20 (and to -10% by T+60)
So the basic pattern following negative rates is to see the yen strengthen (USD/JPY, AUD/JPY etc, lower) and stocks weaken (most notably the banking sector. So, if BOJ neither cuts rates or hints that they will tomorrow, we’d expect a rally in these markets following the meeting.
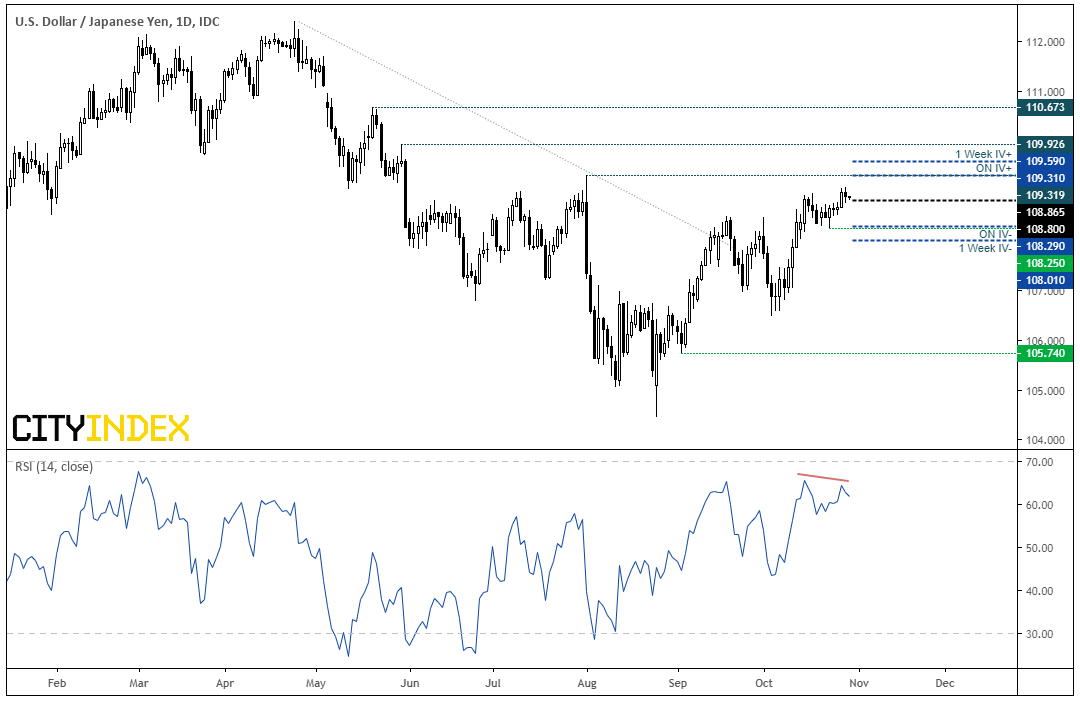
USD/JPY: The daily structure remains bullish, although traders appear cautious around the highs. A small, bearish doji formed yesterday and a bearish divergence has formed with RSI. Interestingly, the overnight implied volatility (ON IV) range falls near 108.25 support and 109.31 resistance, meaning options markets are suggesting a 62% chance prices will close within these levels.
- If BOJ stand pat and trade relations between US and China blossom, we could see this braking to new highs.
- But, remembering that forward returns were positive for JPY last time around, then USD/JPY faces downside potential if BOJ ease, add stimulus or strongly suggest it’s on its way.
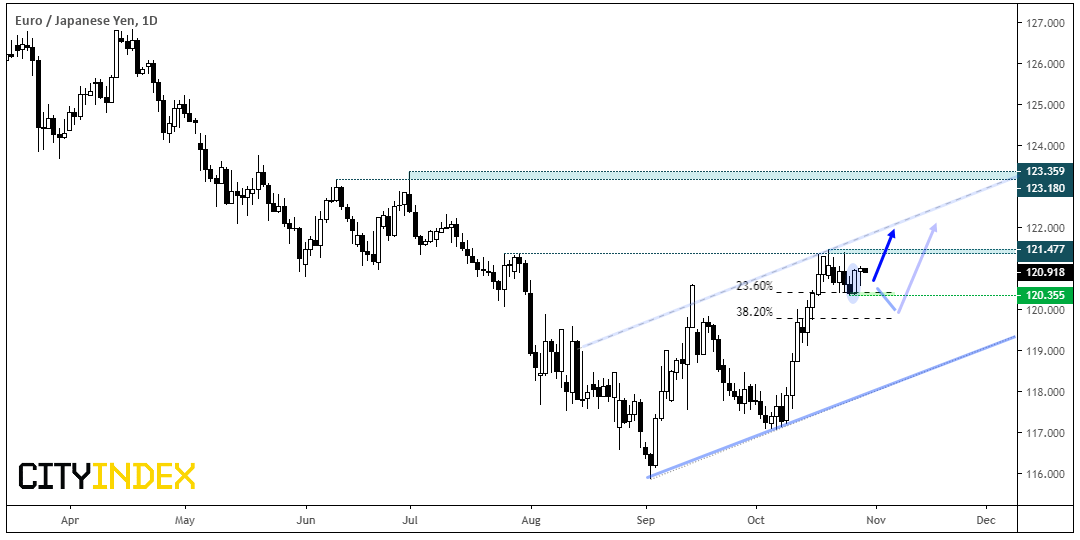
EUR/JPY: Regardless of the outcome tomorrow, the bullish trend structure on EUR/JPY appears firm and trades in a potential bull flag pattern just off its cycle high. A very minor pullback has been seen which and Monday’s bullish engulfing candle suggests the low could be in at 120.35. Whilst it trades within a bullish channel, we’re open for it to break above the upper trendline (hence the dashed line) given the strength of bullish momentum within the channel.
- Bias is for a break to new highs (and possibly up through the trendline) if 120.35 holds as support
- There’s still room for a deeper retracement towards the 38.2% Fibonacci level / 120 handle, so we’ll reassess price action if it breaks below 120.35 and look for a higher to form
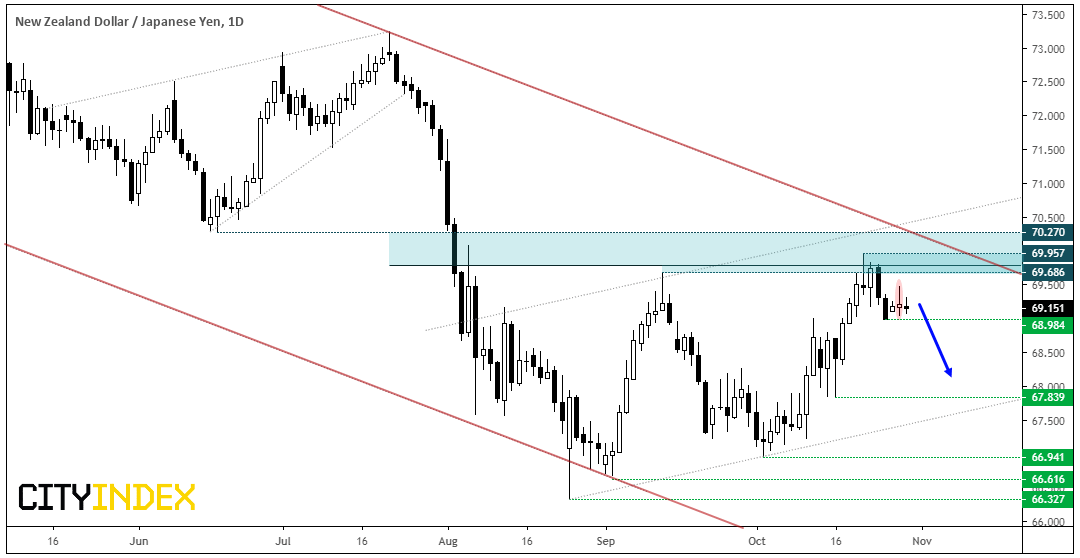
NZD/JPY: Here, the structure appears less convincing for the bull-camp. A bearish pinbar and engulfing candle reaffirmed the resistance zone around the 50% retracement level and the two bearish bears from high show all is not well at these less-than-giddy highs. Furthermore, another pinbar appears yesterday just above 68.98. Given the longer-term bearish channel, large overlaps of prices action between swing in its current ‘bullish’ channel. Price action continues to look corrective against the bearish channel.
- From here, swing traders could wait for a break below 68.94 and target the 67.84 low.
- A bullish argument becomes more appealing if/when it breaks above the bearish channel and starts printing higher lows with much shallower retracements.
FOMC Preview: Rate Cut Priced In, But Powell May Move Markets Regardless
AUD/JPY breaks out ahead of Aussie CPI, BOJ
Is A ‘Risk Reversal’ On The Cards? | SPX, NDX, Yen
This report is intended for general circulation only. It should not be construed as a recommendation, or an offer (or solicitation of an offer) to buy or sell any financial products. The information provided does not take into account your specific investment objectives, financial situation or particular needs. Before you act on any recommendation that may be contained in this report, independent advice ought to be sought from a financial adviser regarding the suitability of the investment product, taking into account your specific investment objectives, financial situation or particular needs.
StoneX Financial Pte. Ltd., may distribute reports produced by its respective foreign entities or affiliates within the StoneX group of companies or third parties pursuant to an arrangement under Regulation 32C of the Financial Advisers Regulations. Where the report is distributed to a person in Singapore who is not an accredited investor, expert investor or an institutional investor (as defined in the Securities Futures Act), StoneX Financial Pte. Ltd. accepts legal responsibility to such persons for the contents of the report only to the extent required by law. Singapore recipients should contact StoneX Financial Pte. Ltd. at 6826 9988 for matters arising from, or in connection with the report.
In the case of all other recipients of this report, to the extent permitted by applicable laws and regulations neither StoneX Financial Pte. Ltd. nor its associated companies will be responsible or liable for any loss or damage incurred arising out of, or in connection with, any use of the information contained in this report and all such liability is hereby expressly disclaimed. No representation or warranty is made, express or implied, that the content of this report is complete or accurate.
StoneX Financial Pte. Ltd. is not under any obligation to update this report.
Trading CFDs and FX on margin carries a high level of risk that may not be suitable for some investors. Consider your investment objectives, level of experience, financial resources, risk appetite and other relevant circumstances carefully. The possibility exists that you could lose some or all of your investments, including your initial deposits. If in doubt, please seek independent expert advice. Visit www.cityindex.com/en-sg/terms-and-policies for the complete Risk Disclosure Statement.
ALL TRADING INVOLVES RISKS. LOSSES CAN EXCEED DEPOSITS.
City Index is a trading name of StoneX Financial Pte. Ltd. (“SFP”) for the offering of dealing services in Contracts for Differences (“CFD”). SFP holds a Capital Markets Services Licence issued by the Monetary Authority of Singapore for Dealing in Exchange-Traded Derivatives Contracts, Over-the-Counter Derivatives Contracts, and Spot Foreign Exchange Contracts for the Purposes of Leveraged Foreign Exchange Trading. SFP is also both Derivatives Trading and Clearing member of the Singapore Exchange (“SGX”). SFP is a wholly-owned subsidiary of StoneX Group Inc.
The information provided herein is intended for general circulation. It does not take into account the specific investment objectives, financial situation or particular needs of any particular person. You should take into account your specific investment objectives, financial situation or particular needs before making a commitment to invest, including seeking advice from an independent financial adviser regarding the suitability of the investment, under a separate engagement, as you deem fit. No representation or warranty is given as to the accuracy or completeness of this information. Consequently, any person acting on it does so entirely at their own risk.
The information does not represent an offer of, or solicitation for, a transaction in any investment product. Any views and opinions expressed may be changed without an update. To understand the risks and costs involved, please visit the section captioned “Important Information” and the “Risk Disclosure Statement”.
The information herein is not directed to, or intended for distribution to or use by, any person or entity who is a citizen or resident of or located in any locality, state, country or other jurisdiction where such distribution, publication, availability or use would be contrary to law or regulation.
StoneX Financial Pte. Ltd. 1 Raffles Place, #18-61, One Raffles Place Tower 2, Singapore 048616. Tel: 6309 1000. Co. Reg. No.: 201130598R.
This advertisement has not been reviewed by the Monetary Authority of Singapore.
© City Index 2024