Boeing woes may not be over despite management change
Medium-term technical outlook on Boeing (BA)
click to enlarge charts
Key Levels (1 to 3 months)
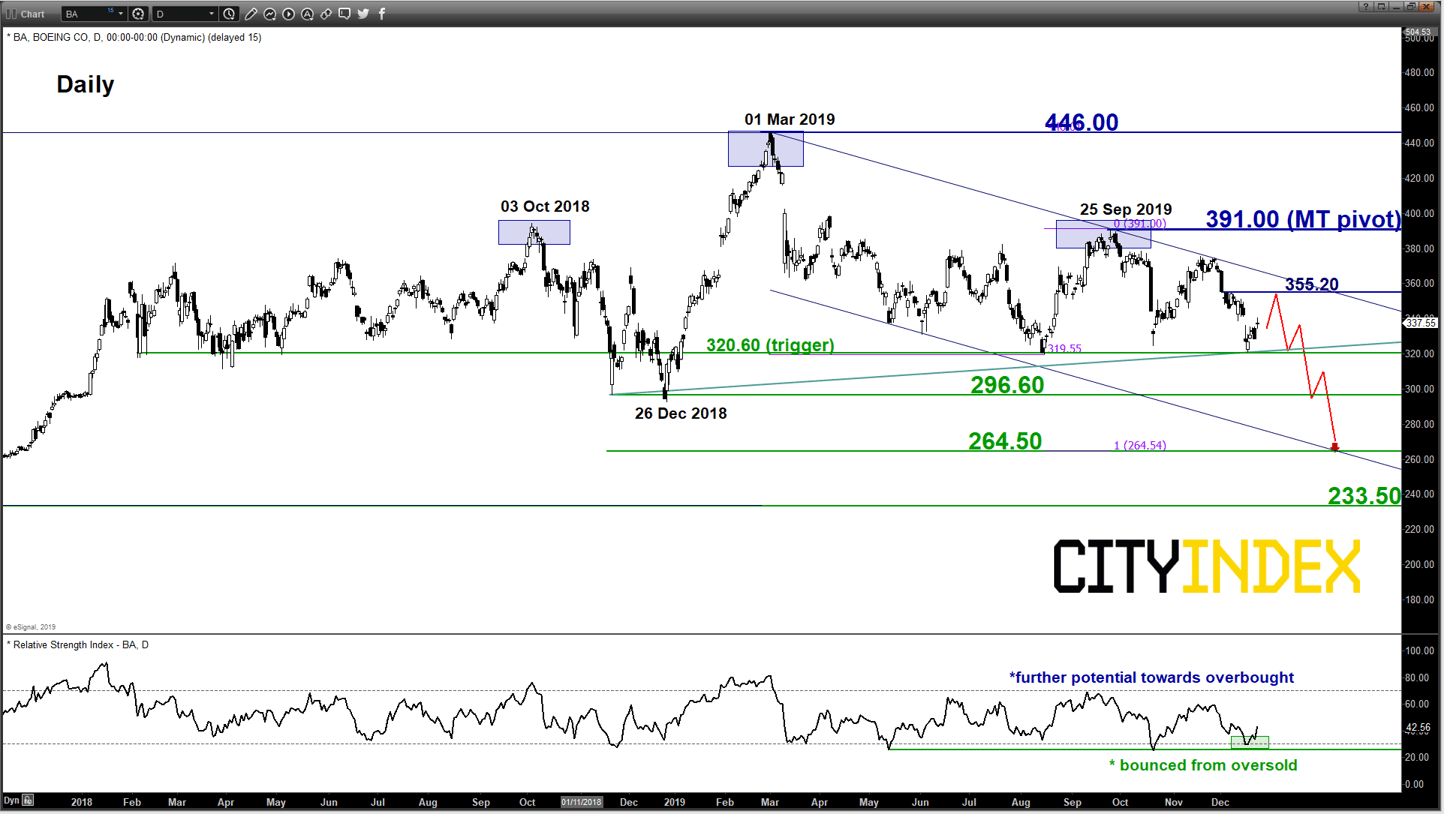
Intermediate resistance: 355.20
Pivot (key resistance): 391.00
Supports: 320.60, 296.60 & 264.50
Next resistance: 446.00
Directional Bias (1 to 3 months)
The share price of Boeing has rallied by 2.91% yesterday with the sudden resignation of CEO Dennis Muilenburg after four weeks of consecutive decline of 14% over the fallout from its 737 Max crisis and the recent failed space travel mission on its unmanned Starliner capsule. Safety lapses in the 737 Max model had led to fatal crashes in 2018 and 2019 and left Boeing in the centre of regulatory and public scrutiny. Chief Financial Officer Greg Smith will serve as interim CEO.
However, technical analysis on the share price of Boeing is not advocating for a bullish “Bottoming” phase at this juncture.
Bearish bias in any bounces below 391.00 key medium-term pivotal resistance and a break with a daily close below 320.60 reinforces the start of a potential multi-week corrective decline sequence to target the next supports at 296.60 and 264.50.
On the other hand, a clearance with a daily close above 391.00 invalidates the bearish scenario for a push up to retest the current all-time high level of 446.00.
Key elements
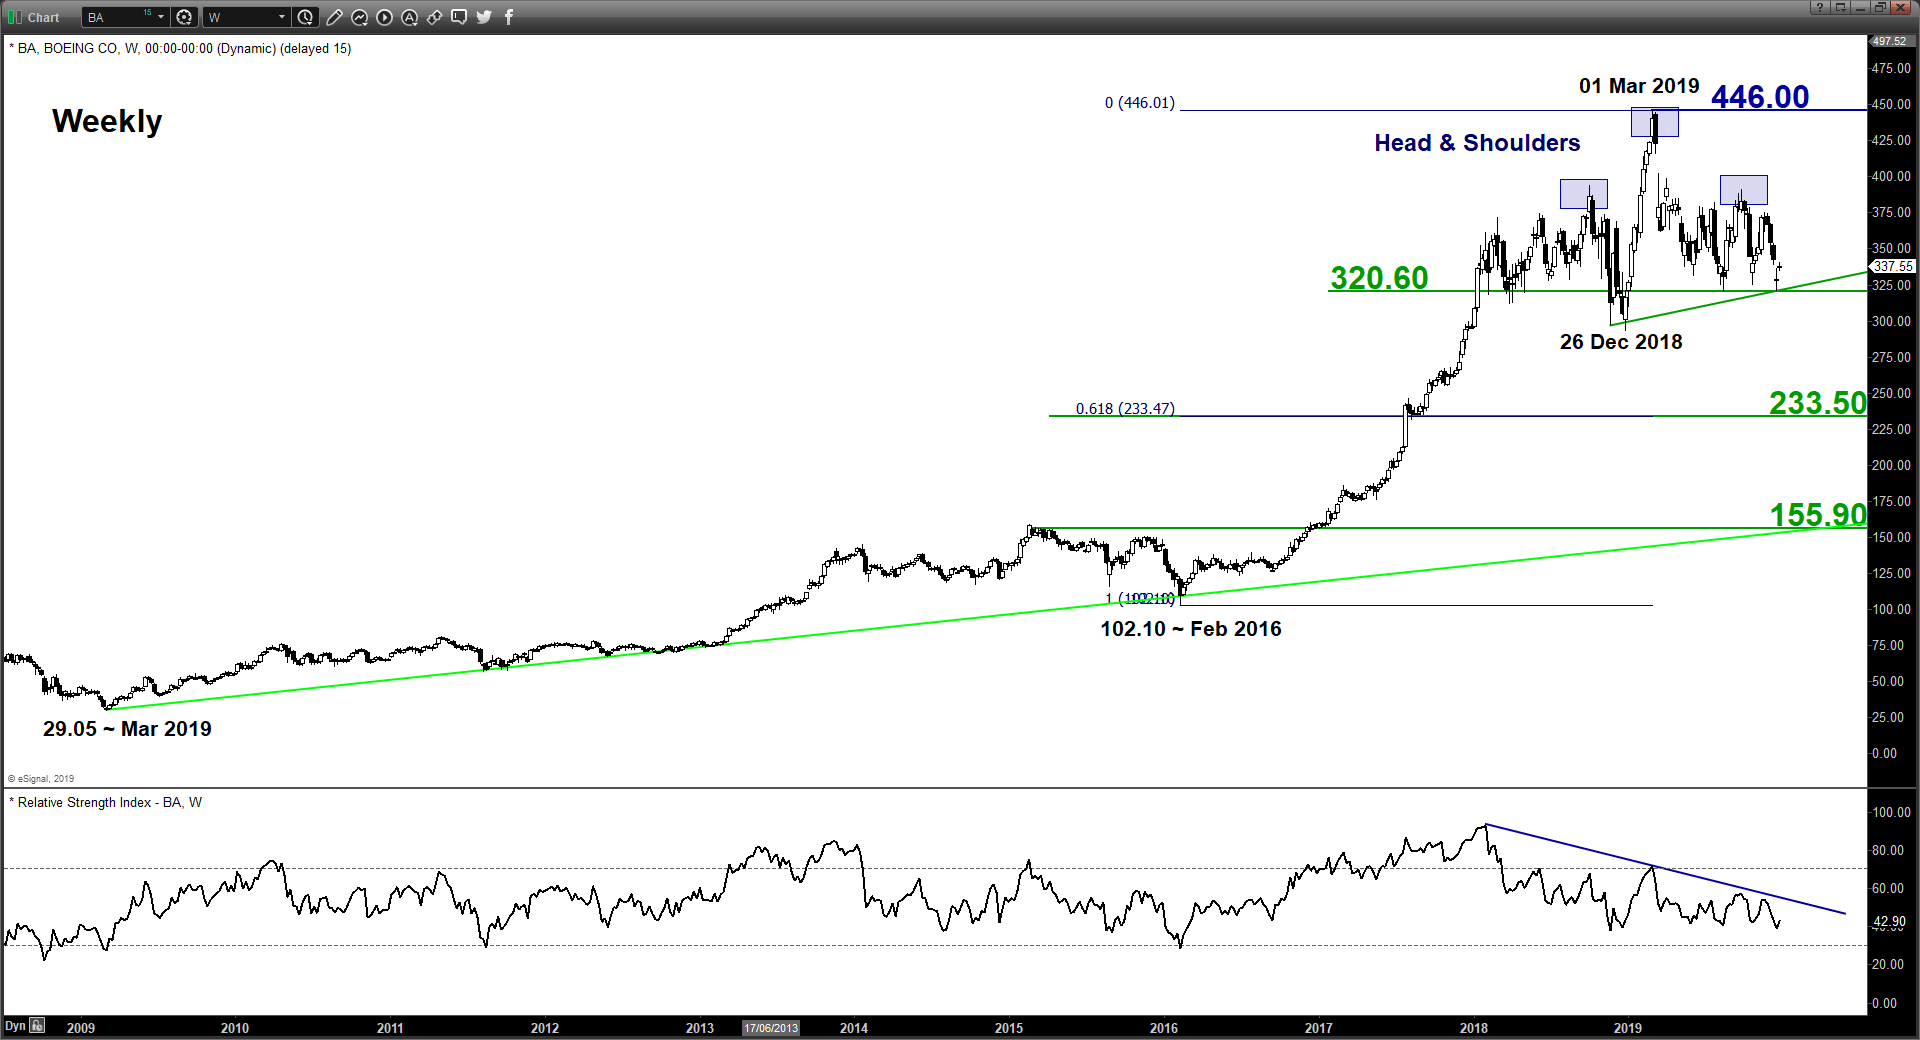
- Since its 446.01 all-time high printed on 01 Mar 2019, Boeing has traced out a major bearish topping configuration, “Head & Shoulders” after a stellar up move of 335% from its Feb 2016 swing low of 102.10.
- The neckline support of “Head & Shoulders” rests at 320.60.
- In the medium-term, its price action has started to evolve within a descending channel from its 01 Mar 2019 all-time high area with its upper boundary now acting as a resistance at 355.20 (see daily chart).
- The daily RSI oscillator has just staged a rebound from its oversold region and still has room to manoeuvre to the upside before it reaches its overbought region. This observation suggests that price action may see a further bounce at this juncture towards the aforementioned descending channel resistance at 355.20.
- The 264.50 medium-term support is defined by the lower boundary of the descending channel and the 1.00 Fibonacci expansion of the decline from 01 Mar 2019 high to 15 Aug 2019 low projected from 25 Sep 2019 high.
Charts are from eSignal
This report is intended for general circulation only. It should not be construed as a recommendation, or an offer (or solicitation of an offer) to buy or sell any financial products. The information provided does not take into account your specific investment objectives, financial situation or particular needs. Before you act on any recommendation that may be contained in this report, independent advice ought to be sought from a financial adviser regarding the suitability of the investment product, taking into account your specific investment objectives, financial situation or particular needs.
StoneX Financial Pte. Ltd., may distribute reports produced by its respective foreign entities or affiliates within the StoneX group of companies or third parties pursuant to an arrangement under Regulation 32C of the Financial Advisers Regulations. Where the report is distributed to a person in Singapore who is not an accredited investor, expert investor or an institutional investor (as defined in the Securities Futures Act), StoneX Financial Pte. Ltd. accepts legal responsibility to such persons for the contents of the report only to the extent required by law. Singapore recipients should contact StoneX Financial Pte. Ltd. at 6826 9988 for matters arising from, or in connection with the report.
In the case of all other recipients of this report, to the extent permitted by applicable laws and regulations neither StoneX Financial Pte. Ltd. nor its associated companies will be responsible or liable for any loss or damage incurred arising out of, or in connection with, any use of the information contained in this report and all such liability is hereby expressly disclaimed. No representation or warranty is made, express or implied, that the content of this report is complete or accurate.
StoneX Financial Pte. Ltd. is not under any obligation to update this report.
Trading CFDs and FX on margin carries a high level of risk that may not be suitable for some investors. Consider your investment objectives, level of experience, financial resources, risk appetite and other relevant circumstances carefully. The possibility exists that you could lose some or all of your investments, including your initial deposits. If in doubt, please seek independent expert advice. Visit www.cityindex.com/en-sg/terms-and-policies for the complete Risk Disclosure Statement.
ALL TRADING INVOLVES RISKS. LOSSES CAN EXCEED DEPOSITS.
City Index is a trading name of StoneX Financial Pte. Ltd. (“SFP”) for the offering of dealing services in Contracts for Differences (“CFD”). SFP holds a Capital Markets Services Licence issued by the Monetary Authority of Singapore for Dealing in Exchange-Traded Derivatives Contracts, Over-the-Counter Derivatives Contracts, and Spot Foreign Exchange Contracts for the Purposes of Leveraged Foreign Exchange Trading. SFP is also both Derivatives Trading and Clearing member of the Singapore Exchange (“SGX”). SFP is a wholly-owned subsidiary of StoneX Group Inc.
The information provided herein is intended for general circulation. It does not take into account the specific investment objectives, financial situation or particular needs of any particular person. You should take into account your specific investment objectives, financial situation or particular needs before making a commitment to invest, including seeking advice from an independent financial adviser regarding the suitability of the investment, under a separate engagement, as you deem fit. No representation or warranty is given as to the accuracy or completeness of this information. Consequently, any person acting on it does so entirely at their own risk.
The information does not represent an offer of, or solicitation for, a transaction in any investment product. Any views and opinions expressed may be changed without an update. To understand the risks and costs involved, please visit the section captioned “Important Information” and the “Risk Disclosure Statement”.
The information herein is not directed to, or intended for distribution to or use by, any person or entity who is a citizen or resident of or located in any locality, state, country or other jurisdiction where such distribution, publication, availability or use would be contrary to law or regulation.
StoneX Financial Pte. Ltd. 1 Raffles Place, #18-61, One Raffles Place Tower 2, Singapore 048616. Tel: 6309 1000. Co. Reg. No.: 201130598R.
This advertisement has not been reviewed by the Monetary Authority of Singapore.
© City Index 2024