ASX Long And Short Of It NAN NCM BOQ GNC
A lacklustre finish for the week puts a potential head and shoulders top in focus for ASX200. We also flag a few equities we're monitoring for breakouts.
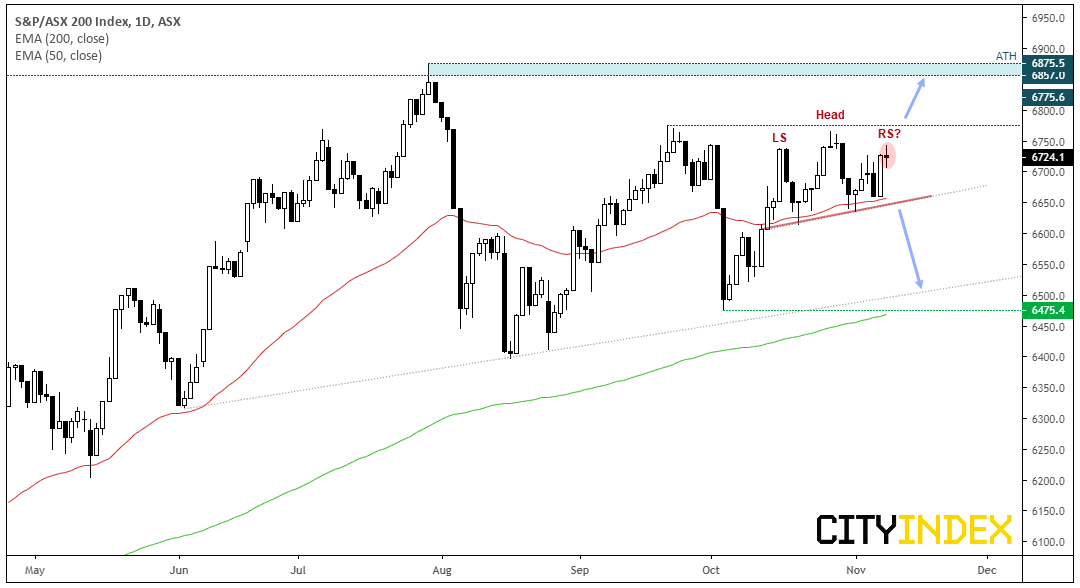
Australia 200 CFD/DFT: The index can’t quite manage to test 6,800, let alone break above it. And this is despite global equities hitting record highs and the US-China trade deal seemingly back on again.
Price action has found support above the 50-day eMA, yet it hesitancy to retest 6775.6 resistance should concern the bull-camp. Moreover, a potential head and shoulders top could be forming which, if successful, projects a bearish target around 6,500.
- Bulls could look to buy dips above the 50-day eMA if their bias is for an eventual break above 6775.6. Alternatively wait for this key level to break.
- Bears could wait for a break of the neckline to confirm the head and shoulders top and target the lows around 6,500.
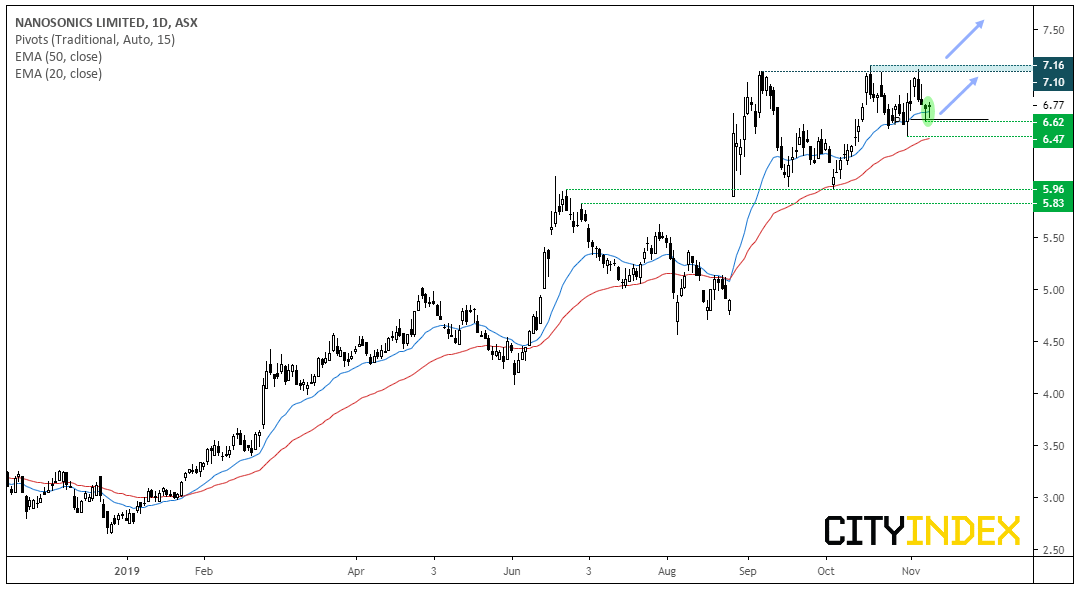
Nanosonic CFD/DFT: Up over 140% YTD and in the strongest sector YTD (health care), we’re now waiting for a bullish breakout. Price action is bobbing along the 50 and 20-day eMA’s and a series of higher highs have formed into resistance, since it gapped higher late August. Whilst its reminiscent of a cup and handle pattern, it could also transform into an ascending triangle.
- Bulls could wait for a break above 7.16 to confirm a bullish continuation pattern.
- Alternatively, bullish swing traders could look to anticipate the breakout whist prices hold above the monthly pivot (around 662).
- As it trades at record highs, an open upside target can be used.
- A break below 6.47 places it onto the backburner.
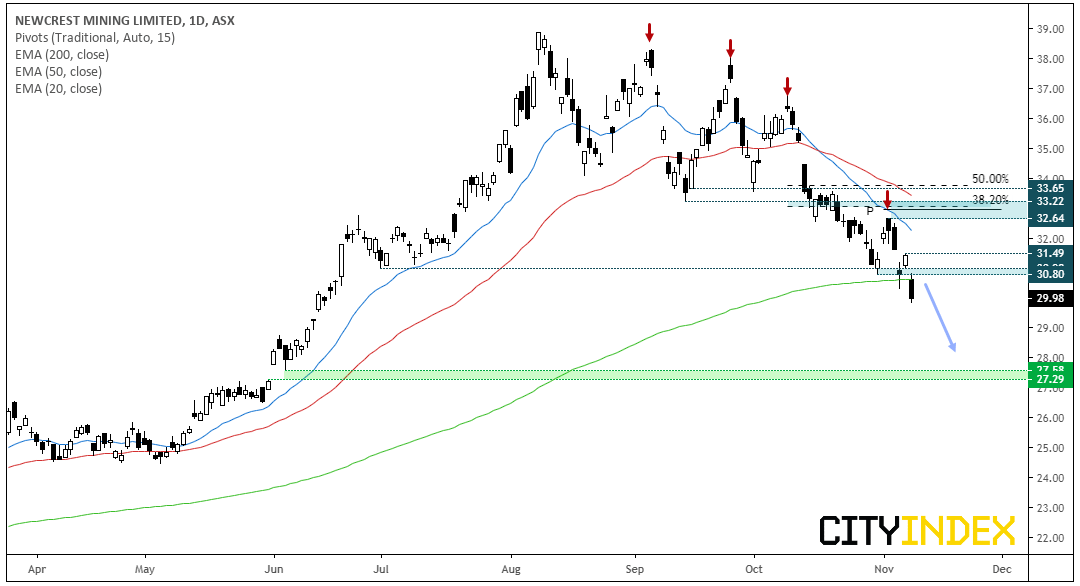
Newcrest Mining CFD/DFT: We flagged this last Friday and said “Newcrest is one to consider if the lust for gold fizzles out”. Well, gold failed to break key resistance and rolled over in style, taking gold miners with it.
It’s rebound didn’t quite make the resistance zone but a clear swing high son at 32.64. The 20-day eMA is beneath the 50 and both point lower, and prices have broken through key support and the 200-day eMA.
- Daily trend remains bearish below 32.64, although the resistance zone around 30.60-31.00 could be used to aid with tighter risk management for bears. There’s also a swing high near 31.50 to consider, for a slightly more conservative swing trade.
- Bears could target the gap around 27.29-27.58 whilst prices remain below the resistance area of their choice.
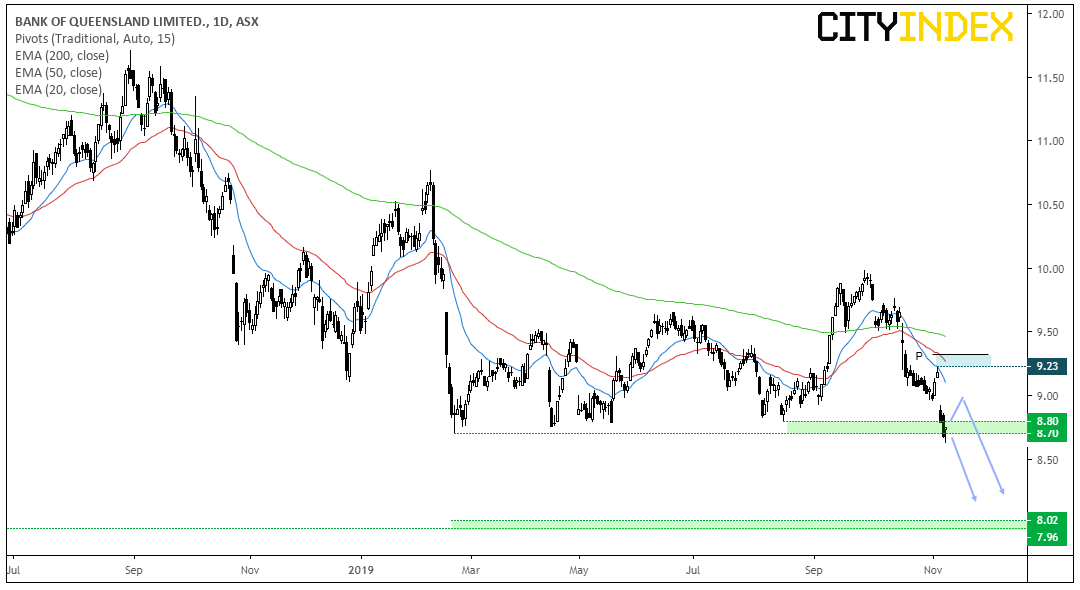
Bank of Queensland CFD: You need to really stand back to appreciate this one, as the its part of a longer-term bearish trend that began in 2017. There’s clearly a battle around the 8.70-8.80 area, although bulls do appear to be on the back foot this time around. After its 9.23 swing high, it gapped notably lower and heavy volume selling took over. Sure, its clinging on to key support now but, given the strength of bearish momentum leading prices here, at best it might achieve a minor bounce before rolling over.
- The bias remains for a bearish breakdown whilst 9.23 caps as resistance, although there is potential for a minor recovery first.
- Counter-trend bulls could look for longs from the monthly S1 level and target somewhere within the gap.
- Bears could look to fade into area of weakness is it bounces from current lows. Or bears could simply trade a break of new lows.
- Bearish target is around $8.00.
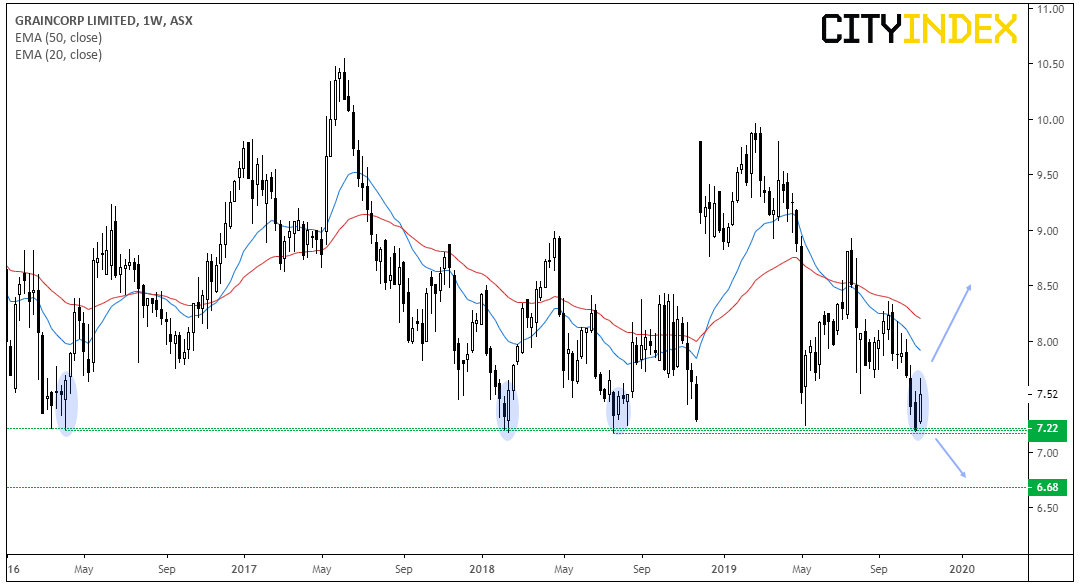
Graincorp CFD: Another chart that requires standing back to appreciate the view. Only this time, we’ve switched to the weekly chart to show how robust the 7.17-7.22 support area has been (although it has held since 2011).
Given this key support level has provided bullish rallies in excess of 35% in the past, then bears may have their work cut out. But if the level breaks, then it would be a significant event indeed.
- A bullish weekly candle has formed above support with a higher low. Bulls could look to enter long on the daily chart with a relatively wide stop / small position and anticipated support hold and seek to scale into the position if it rebounds like it has in the past.
- Bears could seek to enter a break of key support, or wait to see if it caps as resistance following a breakdown.
Related analysis:
S&P500: Long Buybacks And Value?
Gold Perks Up But It’s Not Out Of The Woods | XAU, GDX, KL, AEM, NEM
ASX200 Higher For A Fifth Session, ‘Long’ May It Last?| ASX, CAR, JHX
This report is intended for general circulation only. It should not be construed as a recommendation, or an offer (or solicitation of an offer) to buy or sell any financial products. The information provided does not take into account your specific investment objectives, financial situation or particular needs. Before you act on any recommendation that may be contained in this report, independent advice ought to be sought from a financial adviser regarding the suitability of the investment product, taking into account your specific investment objectives, financial situation or particular needs.
StoneX Financial Pte. Ltd., may distribute reports produced by its respective foreign entities or affiliates within the StoneX group of companies or third parties pursuant to an arrangement under Regulation 32C of the Financial Advisers Regulations. Where the report is distributed to a person in Singapore who is not an accredited investor, expert investor or an institutional investor (as defined in the Securities Futures Act), StoneX Financial Pte. Ltd. accepts legal responsibility to such persons for the contents of the report only to the extent required by law. Singapore recipients should contact StoneX Financial Pte. Ltd. at 6826 9988 for matters arising from, or in connection with the report.
In the case of all other recipients of this report, to the extent permitted by applicable laws and regulations neither StoneX Financial Pte. Ltd. nor its associated companies will be responsible or liable for any loss or damage incurred arising out of, or in connection with, any use of the information contained in this report and all such liability is hereby expressly disclaimed. No representation or warranty is made, express or implied, that the content of this report is complete or accurate.
StoneX Financial Pte. Ltd. is not under any obligation to update this report.
Trading CFDs and FX on margin carries a high level of risk that may not be suitable for some investors. Consider your investment objectives, level of experience, financial resources, risk appetite and other relevant circumstances carefully. The possibility exists that you could lose some or all of your investments, including your initial deposits. If in doubt, please seek independent expert advice. Visit www.cityindex.com/en-sg/terms-and-policies for the complete Risk Disclosure Statement.
ALL TRADING INVOLVES RISKS. LOSSES CAN EXCEED DEPOSITS.
City Index is a trading name of StoneX Financial Pte. Ltd. (“SFP”) for the offering of dealing services in Contracts for Differences (“CFD”). SFP holds a Capital Markets Services Licence issued by the Monetary Authority of Singapore for Dealing in Exchange-Traded Derivatives Contracts, Over-the-Counter Derivatives Contracts, and Spot Foreign Exchange Contracts for the Purposes of Leveraged Foreign Exchange Trading. SFP is also both Derivatives Trading and Clearing member of the Singapore Exchange (“SGX”). SFP is a wholly-owned subsidiary of StoneX Group Inc.
The information provided herein is intended for general circulation. It does not take into account the specific investment objectives, financial situation or particular needs of any particular person. You should take into account your specific investment objectives, financial situation or particular needs before making a commitment to invest, including seeking advice from an independent financial adviser regarding the suitability of the investment, under a separate engagement, as you deem fit. No representation or warranty is given as to the accuracy or completeness of this information. Consequently, any person acting on it does so entirely at their own risk.
The information does not represent an offer of, or solicitation for, a transaction in any investment product. Any views and opinions expressed may be changed without an update. To understand the risks and costs involved, please visit the section captioned “Important Information” and the “Risk Disclosure Statement”.
The information herein is not directed to, or intended for distribution to or use by, any person or entity who is a citizen or resident of or located in any locality, state, country or other jurisdiction where such distribution, publication, availability or use would be contrary to law or regulation.
StoneX Financial Pte. Ltd. 1 Raffles Place, #18-61, One Raffles Place Tower 2, Singapore 048616. Tel: 6309 1000. Co. Reg. No.: 201130598R.
This advertisement has not been reviewed by the Monetary Authority of Singapore.
© City Index 2024