Anglo shares poised to keep outpacing FTSE rivals
Measured iron ore exposure and modest valuation are key
Anglo American, the £26bn mining group, continues to outpace FTSE 100 rivals after a volatile year for basic resource suppliers. Note that Anglo was also among only a handful of large-cap shares with a high-positive score in our recent technical analysis screen, that aimed to discover UK shares with the most, and least, promising medium-term outlooks. Broadly improved appetite for risk over the last couple of months or so has provided firmer ground for the sector, though not before a trade deal began to unravel in May, coinciding with a deepening downturn in China, the world’s biggest consumer of base metals. Now, Anglo trades 17% higher in 2019. That compares with an 8% year-to-date advance by the FTSE 350 mining index, but both price returns have been ravaged by 2019 challenges. Anglo pulled almost 30% higher for the year in mid-June. The FTSE 350 mining index saw its best levels around a couple of months earlier, rising about 23%.
After the slump, most UK-listed base metal shares have drifted higher, though it’s been a grind. For most, the main hope is that getting a ‘phase one’ deal over the line—eventually—will help put a floor under demand for copper, iron ore, aluminium and other heavy minerals. There’s little certainty in the demand outlook though. For Anglo, the fundamental horizon is just as ambivalent. The group pivoted back to metallurgical and coking coal in 2018, but has had to change track this year as production economics shifted again.
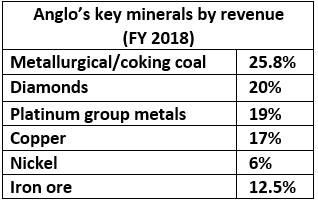
Anglo American Plc. minerals by revenue – FY 2018
Source: Bloomberg/City Index
The rise of precious metal prices this year, in the wake of gold, which also underpinned diamond prices, helped Anglo’s stock outperform shares of iron ore-focused giants like Rio and BHP. Ironically, Anglo has more recently been ramping iron ore production, with an exponential 94.9% year-on-year surge in 2019’s first half. Production stood at 21.6% of revenues by July vs. 11.7% a year before. And it is iron ore demand that looks best supported in coming months. Drivers include port inventories from China that began to turn lower at the beginning of Q4, according to Bloomberg data, together with a pick-up in infrastructure investment. Bloomberg also cites a 20 million metric ton deficit in 2019. However, an expected supply-side normalisation in China may weigh from Q2 2020. If seen, Anglo’s measured iron ore exposure would remain an advantage.
Readings aren’t so bright for Anglo’s current chief revenue generator met coal, with uncertainty over shipments to China into 2020 after quotas prevailed throughout October. South Africa, Anglo’s main coal producing country, saw flat volumes at the end of Q3. Diamond production fell 15.7% on the year, the fifth straight monthly fall. Platinum output also weakened.
A picture emerges of a better-diversified and nimbler miner than its FTSE 100 rivals, helping explain the stock’s outperformance. A huge gap in total return versus peers—37.4% over the last year against the FTSE All-Share Mining Index’s 11.3%—is another factor, though bear in mind it partly reflects an outsize $1bn buyback announced in July. At the same time, Anglo trades below counterparts on a number of valuation models. For example its 4.6x ratio of market value over underlying earnings (EV/EBITDA) trails the peer group average by 37%. Still, after the battering the industry received over the past year, most stocks trade below historical averages. Furthermore, after sharp stock price declines rivals’ higher multiples can deceive. Combined with a better optimised output focus, Anglo’s modest ratings should do no harm to the shares in the months ahead.
Chart points
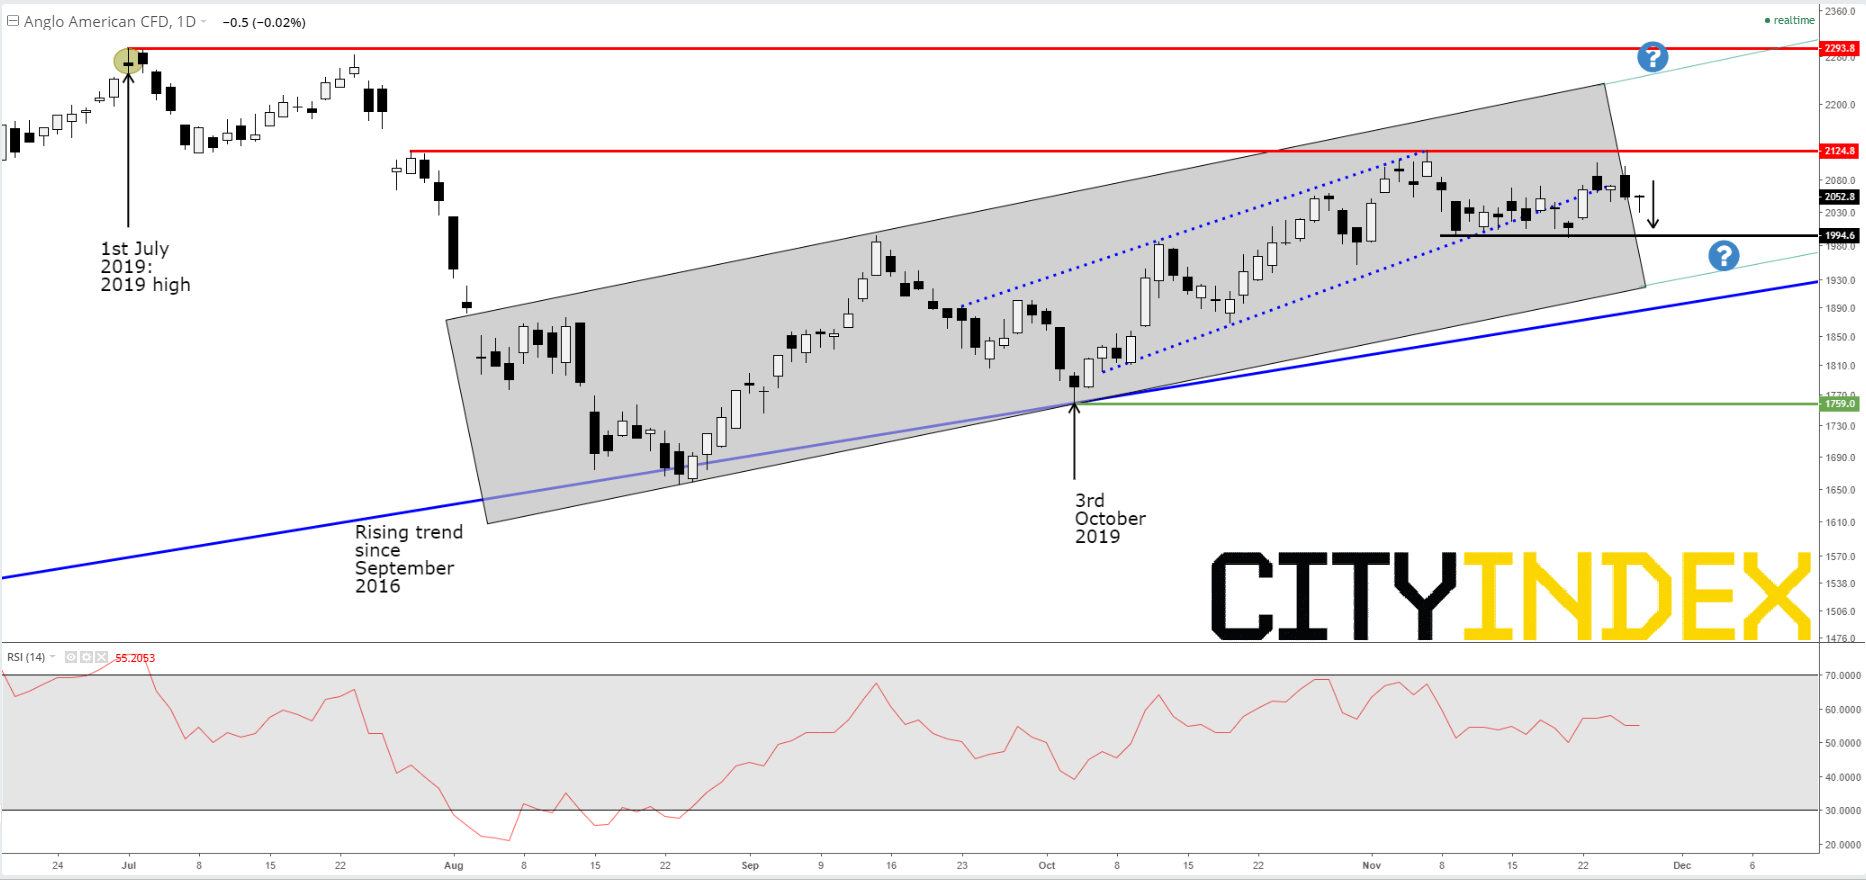
An almost sparkling clean rising trend line since September 2016 continues to support the overall technical buying case. Since marking the high for the year at 2293.8p on 1st July though, AAL has struggled to extend the upside. Additional resistance was created at 2124.8p at the end of that month with a short-lived attempt to break the correction that ensued between July and August. Since then, with assistance from the long-term trend mentioned above, AAL has mapped out a rectangular channel, though the prospective bounds haven’t been tagged since October as the shares marked and recently broke below a shorter-term flag between September and early-November, corroborating 2124.8p resistance. A base has been evident since 11th November around 1994p and would be a precursor of an additional test of a shorter, more limited rising channel in place since the autumn. Below that, the main long-term rising line, would be in play. The overarching bull case would begin to face questions below these structures, with 1759p, 3rd October’s kickback support, a possible decider.
Anglo American Plc. CFD – Daily
Source: City Index
This report is intended for general circulation only. It should not be construed as a recommendation, or an offer (or solicitation of an offer) to buy or sell any financial products. The information provided does not take into account your specific investment objectives, financial situation or particular needs. Before you act on any recommendation that may be contained in this report, independent advice ought to be sought from a financial adviser regarding the suitability of the investment product, taking into account your specific investment objectives, financial situation or particular needs.
StoneX Financial Pte. Ltd., may distribute reports produced by its respective foreign entities or affiliates within the StoneX group of companies or third parties pursuant to an arrangement under Regulation 32C of the Financial Advisers Regulations. Where the report is distributed to a person in Singapore who is not an accredited investor, expert investor or an institutional investor (as defined in the Securities Futures Act), StoneX Financial Pte. Ltd. accepts legal responsibility to such persons for the contents of the report only to the extent required by law. Singapore recipients should contact StoneX Financial Pte. Ltd. at 6826 9988 for matters arising from, or in connection with the report.
In the case of all other recipients of this report, to the extent permitted by applicable laws and regulations neither StoneX Financial Pte. Ltd. nor its associated companies will be responsible or liable for any loss or damage incurred arising out of, or in connection with, any use of the information contained in this report and all such liability is hereby expressly disclaimed. No representation or warranty is made, express or implied, that the content of this report is complete or accurate.
StoneX Financial Pte. Ltd. is not under any obligation to update this report.
Trading CFDs and FX on margin carries a high level of risk that may not be suitable for some investors. Consider your investment objectives, level of experience, financial resources, risk appetite and other relevant circumstances carefully. The possibility exists that you could lose some or all of your investments, including your initial deposits. If in doubt, please seek independent expert advice. Visit www.cityindex.com/en-sg/terms-and-policies for the complete Risk Disclosure Statement.
ALL TRADING INVOLVES RISKS. LOSSES CAN EXCEED DEPOSITS.
City Index is a trading name of StoneX Financial Pte. Ltd. (“SFP”) for the offering of dealing services in Contracts for Differences (“CFD”). SFP holds a Capital Markets Services Licence issued by the Monetary Authority of Singapore for Dealing in Exchange-Traded Derivatives Contracts, Over-the-Counter Derivatives Contracts, and Spot Foreign Exchange Contracts for the Purposes of Leveraged Foreign Exchange Trading. SFP is also both Derivatives Trading and Clearing member of the Singapore Exchange (“SGX”). SFP is a wholly-owned subsidiary of StoneX Group Inc.
The information provided herein is intended for general circulation. It does not take into account the specific investment objectives, financial situation or particular needs of any particular person. You should take into account your specific investment objectives, financial situation or particular needs before making a commitment to invest, including seeking advice from an independent financial adviser regarding the suitability of the investment, under a separate engagement, as you deem fit. No representation or warranty is given as to the accuracy or completeness of this information. Consequently, any person acting on it does so entirely at their own risk.
The information does not represent an offer of, or solicitation for, a transaction in any investment product. Any views and opinions expressed may be changed without an update. To understand the risks and costs involved, please visit the section captioned “Important Information” and the “Risk Disclosure Statement”.
The information herein is not directed to, or intended for distribution to or use by, any person or entity who is a citizen or resident of or located in any locality, state, country or other jurisdiction where such distribution, publication, availability or use would be contrary to law or regulation.
StoneX Financial Pte. Ltd. 1 Raffles Place, #18-61, One Raffles Place Tower 2, Singapore 048616. Tel: 6309 1000. Co. Reg. No.: 201130598R.
This advertisement has not been reviewed by the Monetary Authority of Singapore.
© City Index 2024