

GBP/USD inches higher ahead of the non-farm payroll report
- GBP/USD is supported by USD weakness post-Fed meeting
- 243K jobs are expected to have been added in April
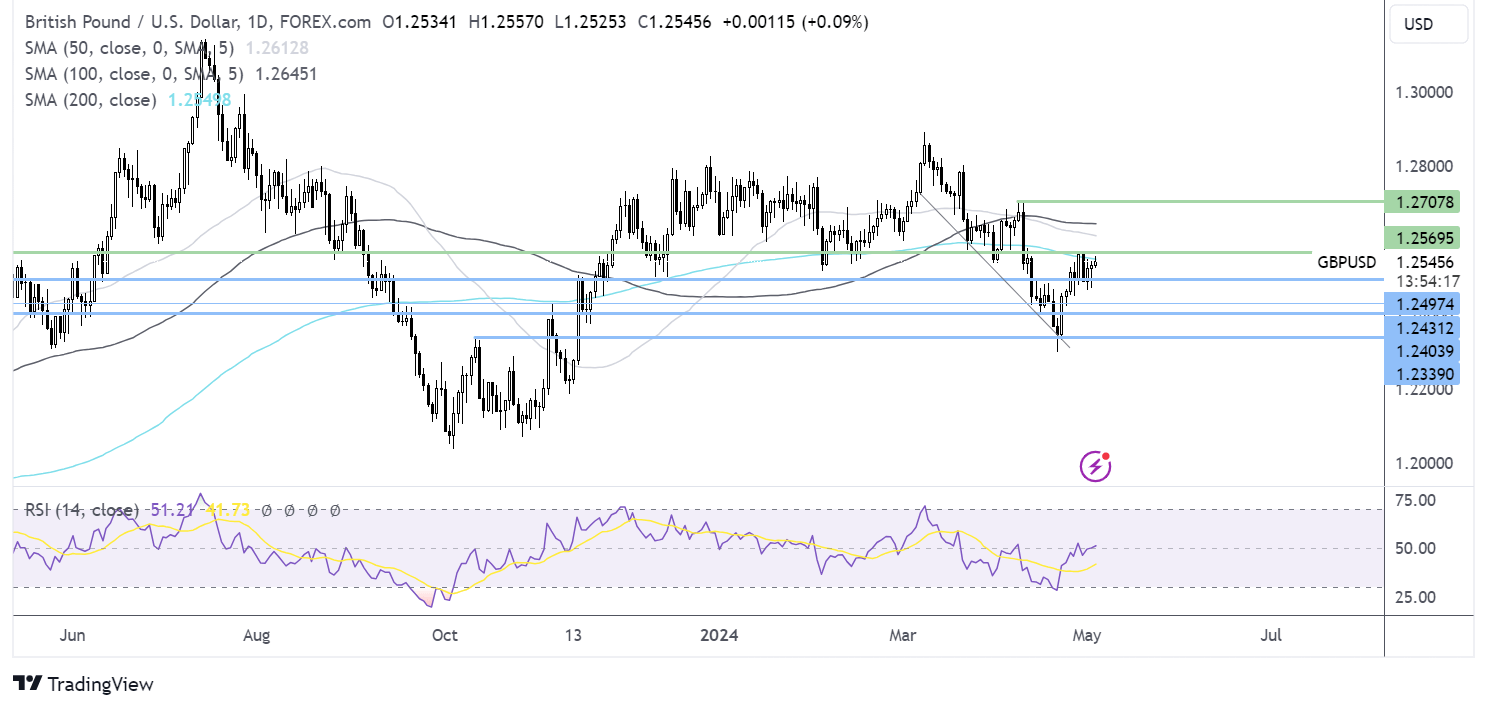
- GBP/USD is caught between 1.25 & 200 SMA at 1.2570
GBP/USD is inching higher for a third straight day, lifted by U.S. dollar weakness following the Federal Reserve interest rate decision and ahead of today's nonfarm payroll report.
The market is looking to the nonfarm payroll data today to guide the tone for the dollar after Federal Reserve chair Jerome Powell indicated that the central bank's next move would likely be a rate cut rather than a rate hike as some had feared.
Expectations are for 243K jobs to have been added in April, down slightly from 303 K in the previous month. Unemployment is expected To hold steady at 3.8%, and average hourly earnings are set to rise 0.3% Month over Month in April.
The stronger-than-expected ADP private payroll report, as well as the rise in the employment sub-component of the ISM manufacturing report and solid jobless claims, suggest that we could have a stronger-than-expected nonfarm payroll report, which could support the view that rates will remain high for longer, supporting the US dollar.
The pound is managing to show resilience but is failing to rise firmly higher after the OECD downwardly revised the UK growth forecasts for 2024 and expects the UK to see this lowest level of growth out of the G7 economies in 2025.
With no UK economic data due today the US dollar will likely be in the driving seat. Attention will be on next week's Bank of England interest rate decision, where the central bank is likely to leave rates on hold but could provide some further clues over the timing of the first rate cut.

GBP/USD forecast – technical analysis
GBP/USD has extended its recovery from 1.23, running into resistance at 1.2570, the 200 SMA. Buyers will need to rise above this level to extend the bullish momentum toward the 100 SMA 1.2650, the 100 SMA, and 1.27, the April high.
On the downside, stronger-than-expected US jobs data could see GBP/USD break below 1.25 support, bringing 1.24 into focus.
Oil set for worst weekly loss in 3-month
- Oil has steadied after falling 5% so far this week
- Oil demand concerns & fading risk premium pulled the price lower
- OPEC+ meeting in June could offer support
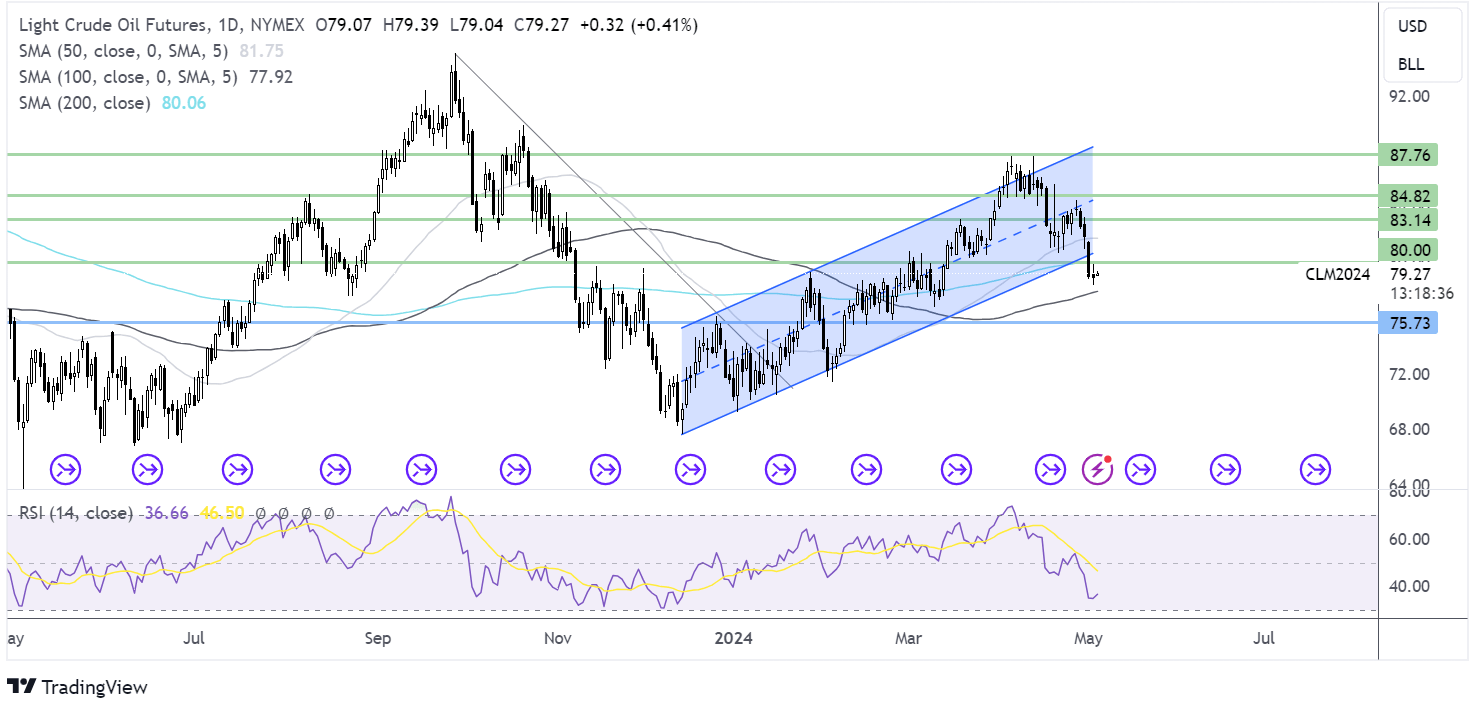
- Oil has fallen out of its rising channel
Oil is edging higher on Friday on the prospect of OPEC+ continuing output cuts. However, oil is still set for its steepest weekly loss in three months as concerns over the demand outlook and easing tensions in the Middle East pulled the price lower.
The prospect of higher interest rates for longer, which could curb growth in the US, the world's largest oil consumer, is hurting the demand outlook. Furthermore, high inflation, high borrowing costs, and low consumer confidence could impact the key US driving season.
Meanwhile, the geopolitical risk premium due to the Israel-Hamas war has also faded, with both sides considering a temporary ceasefire. Talks with international mediators are ongoing.
The fall in oil prices comes just weeks ahead of the next OPEC+ meeting, where the group could extend its voluntary output cuts of 2.2 million barrels per day beyond June, which would support prices.
Attention now turns to the US nonfarm payroll, which could provide an index of the strength of the US job market. The Federal Reserve will consider this when setting interest rates.
Stronger-than-expected US job data could fuel expectations that the Fed will keep rates higher for longer, weighing on the oil demand outlook.
Also, the Baker Hughes rig count is due later today.
Oil forecast- technical analysis
Oil has broken out below its rising channel dating back to December last year and below its 200 SMA. This, combined with the RSI below 50, keeps sellers hopeful of further downside.
The price has found support at 78.40. A break below here is needed to extend the selloff towards 77.70, the 100 SMA, and 75.70, the mid-February low.
On the upside, any recovery needs to rise above 80.00, the psychological level, and the 200 SMA.
Latest market news
Yesterday 08:00 PM
Yesterday 08:00 AM
Yesterday 02:00 AM
May 17, 2024 03:00 PM
May 17, 2024 02:12 PM
May 17, 2024 01:23 PM
Latest Two Trades to Watch articles

May 16, 2024 08:03 AM

May 15, 2024 08:05 AM

May 14, 2024 07:58 AM

May 13, 2024 08:50 AM