


August 23, 2021 5:47 PM
Which is better to own right now: Silver or Gold?
On August 7th, 2020, Silver (XAG/USD) made an all-time high at 29.857. That was the beginning of a long-term symmetrical triangle! After pulling back from that high, Silver fell to low of 21.667 on September 24th, 2021. However, on February 1st the previous high was briefly taken out by a few cents, as the folks at Reddit got behind the precious metal and rallied it from 26.991 all the way to 30.082. Silver oscillated within the symmetrical triangle until August 6th, when it broke aggressively lower to 22.259. Price is currently trading roughly $3 beneath than the triangle, however nearing resistance (previous support) at 23.96. If Silver breaks above, next resistance is at 24.562 and then 25.555.
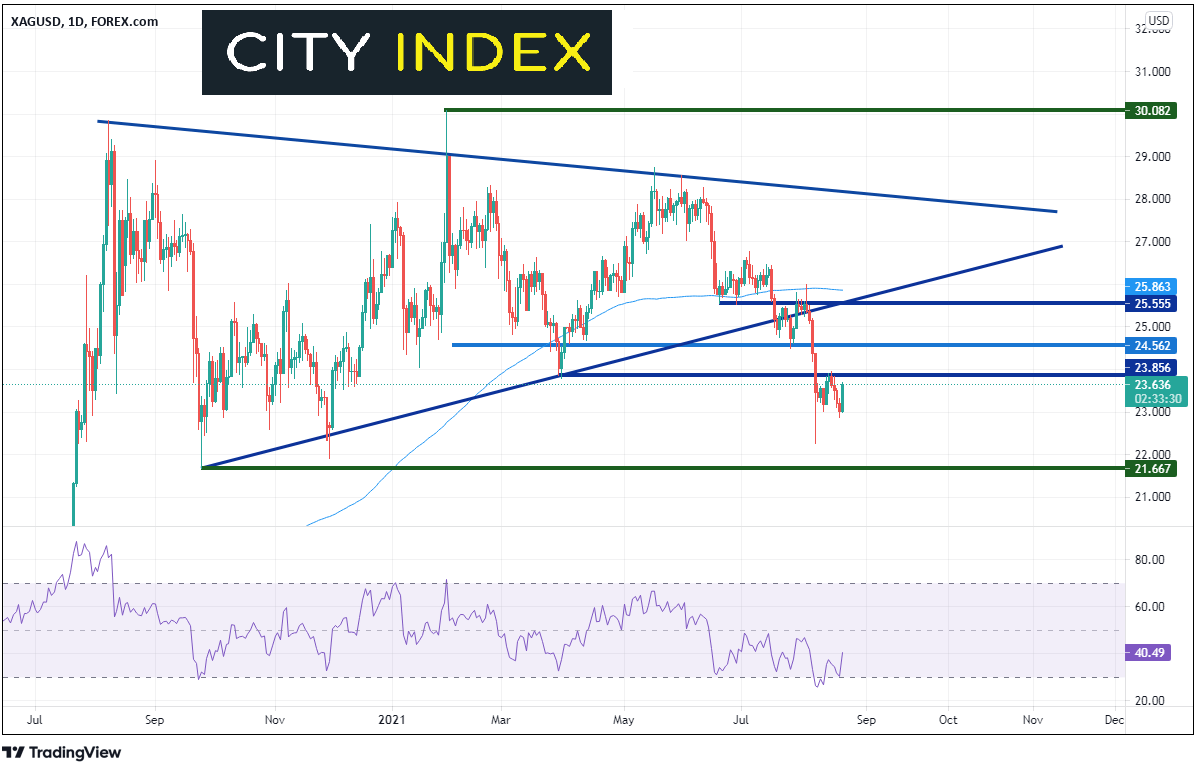
Source: Tradingview, Stone X
Gold (XAU/USD) has had similar price action to Silver since putting in a high of 2075.11 on August 7th, 2020. However, Gold continued to make lower lows until March 31st (whereas Silver was forming higher lows) near 1667.88. The precious metal moved above the downward trendline to 1916.92 on June 1st, however, has failed to trade higher since. Price has tested the 1678.88 level 3 times and is currently testing a strong resistance zone between 1805.87 and 1811.18, which is made up of horizontal resistance and the 200 Day Moving Average. If price breaks above, there is the 61.8% Fibonacci retracement level from the highs of June 1st to the recent touch of 1678.88 near 1825.90 and more horizontal resistance near 1833.95.
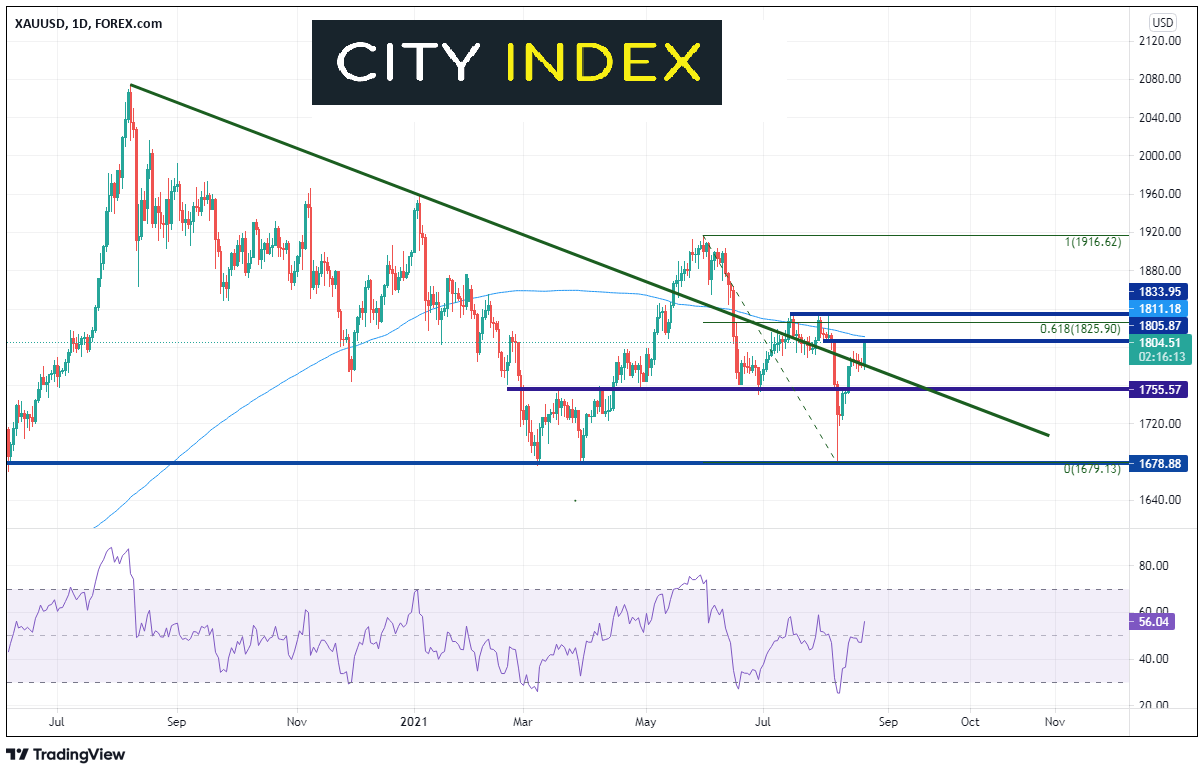
Source: Tradingview, Stone X
Now let’s turn our attention to the Gold/Silver ratio (XAU/XAG). Over the same timeframe, the ratio has been relatively rangebound between 62.066 and 85.82. XAU/XAG put in a low at 62.066 on February 1st (the same day Silver made its all time high) and has been moving sideways/higher since. On July 19th the ratio moved about the 200 Day Moving Average near 70.735 and broke above horizontal resistance on August 18th near 75.332. On Friday, the ratio managed to trade through the 61.8% Fibonacci retracement level from the September 24th, 2020 highs to the February 1st lows near 76.582. However, today the ratio has pulled back below. Notice also that the RSI has just pulled back from overbought territory (70) and may be looking to run lower. If so, gold may underperform Silver in the near-term and Silver will be the relatively better buy than Gold. However, if the ratio holds 75.332 (former resistance), the ratio could continue to move higher towards the previous highs at 85.52. If this happens, Gold would be the better precious metal to own relative to Silver.
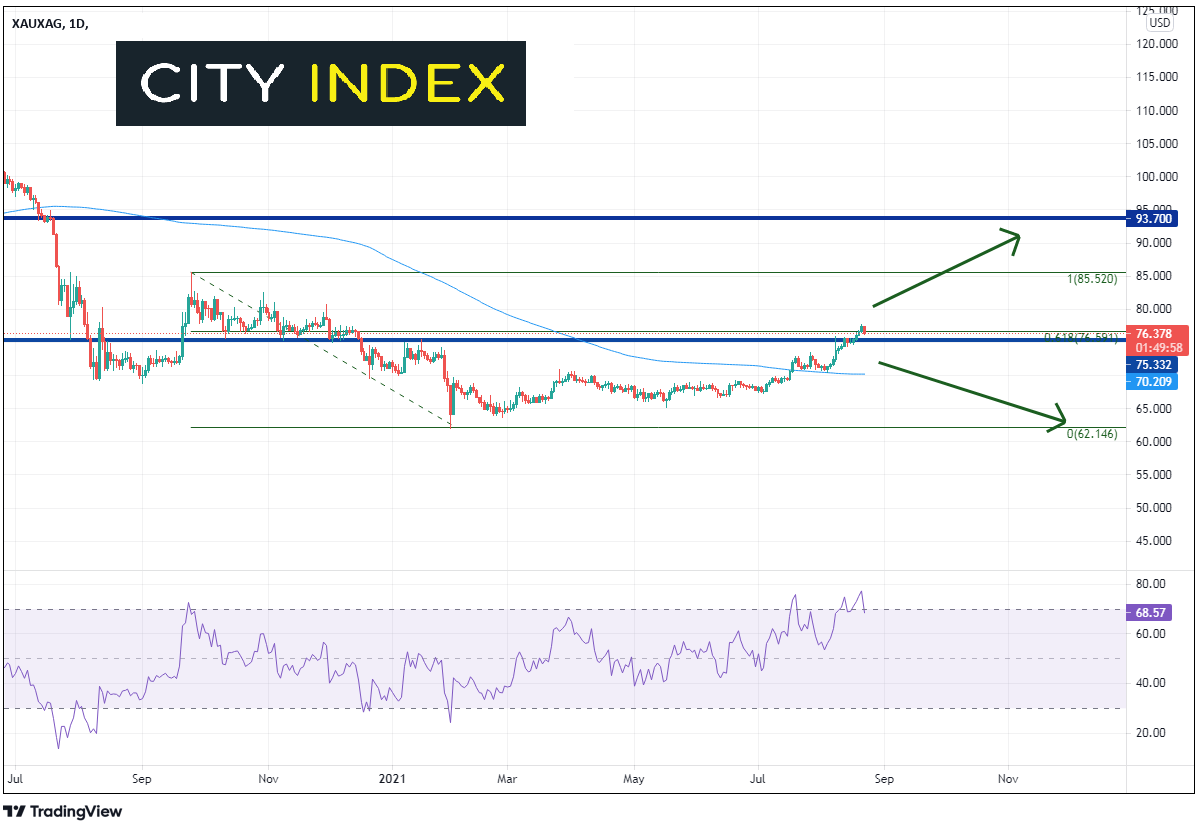
Source: Tradingview, Stone X
Learn more about the Gold/Silver ratio
With Gold running into a confluence of resistance and the Gold/Silver ratio moving lower today, Silver may be the better option to own in the short-term. However, if the ratio holds above the 200 Day Moving Average near 70.29 and the RSI can unwind a bit, Gold may be the precious metal to turn to as it may perform Silver in the longer-term.
Learn more about gold and silver trading opportunities.
Latest market news
Yesterday 01:23 PM
Yesterday 06:01 AM
April 18, 2024 11:27 PM
April 18, 2024 04:46 PM
Latest Commodities articles
April 17, 2024 03:02 AM
April 15, 2024 12:48 AM
April 14, 2024 11:37 PM