


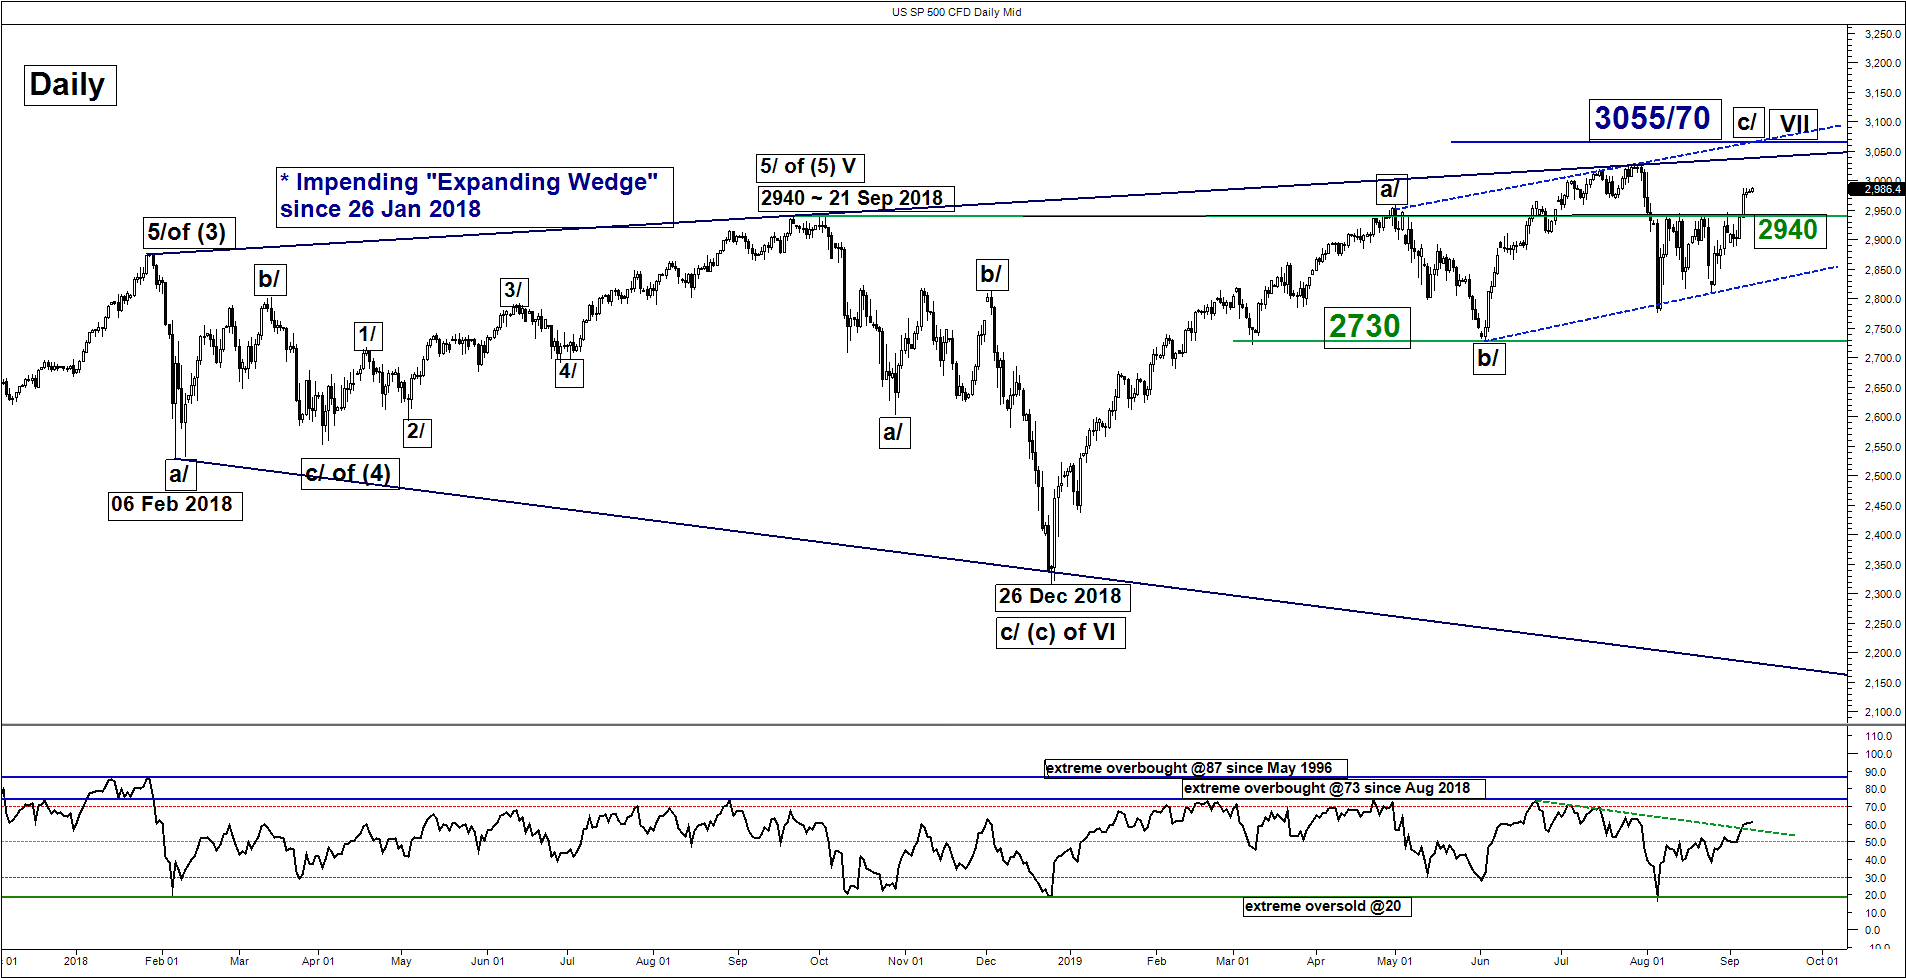
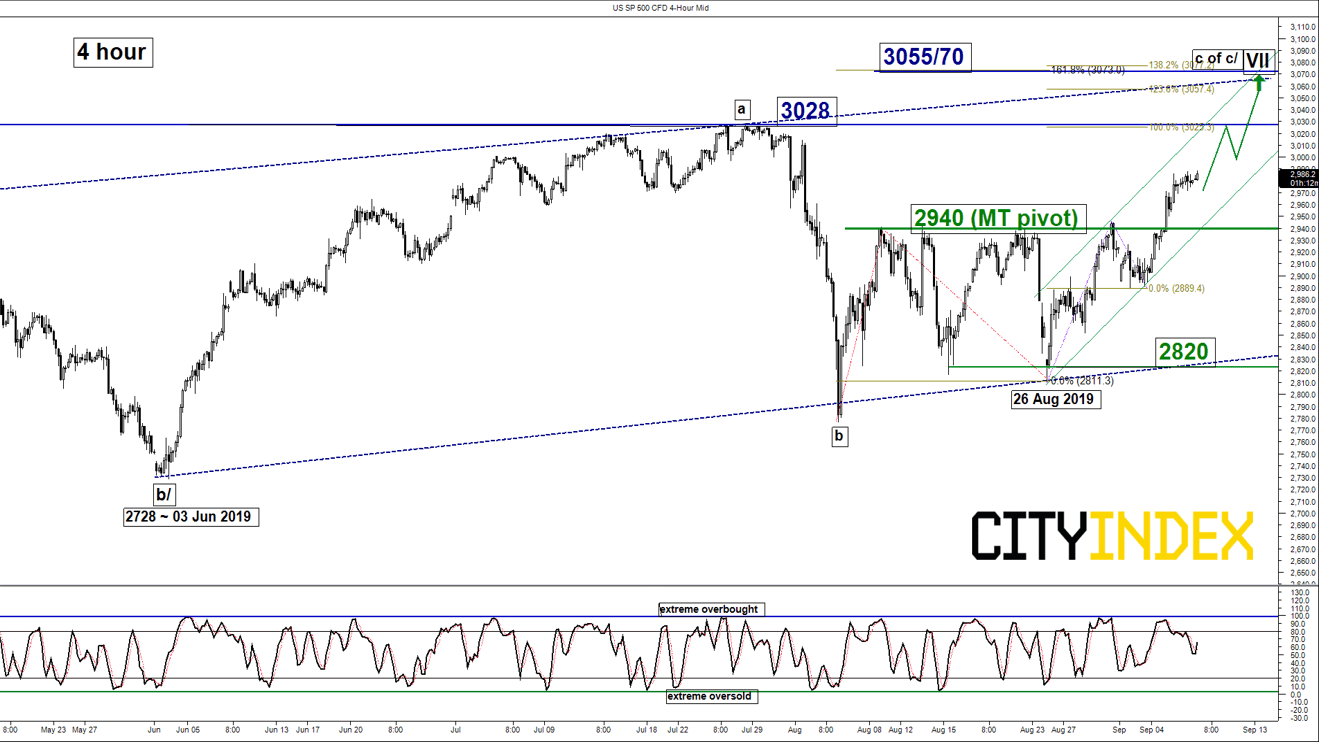
S&P 500 – Bullish break from range
click to enlarge charts
Key Levels (1 to 3 weeks)
Pivot (key support): 2940
Resistances: 3028 (all-time high) & 3055/70
Next support: 2820
Directional Bias (1 to 3 weeks)
The SP 500 Index (proxy for the S&P 500 futures) has broken above the 2941 upper limit/resistance of a 4-week range configuration in place since 06 Aug 2019 that has invalidated the preferred multi-week bearish bias (click here for a recap).
Flip to a bullish bias in any dips above 2940 key medium-term pivotal support for a further potential push up to retest the current all-time high of 3028 before targeting the next resistance at 3055/70 within a major bearish ‘Expanding Wedge” configuration in place since 26 Jan 2018.
On the other hand, a daily close below 2940 indicates a failure bullish breakout to see another round of choppy decline towards the 2820 support (lower boundary of an ascending range since 03 Jan 2019).
Key elements
- The daily RSI oscillator has broken above a significant corresponding descending resistance that suggests a revival of medium-term upside momentum.
- The next medium-term significant resistance stands at 3055/70 which is defined by the intersection of the (upper boundaries of the “Expanding Wedge” from 26 Jan 2018 & ascending range from 03 Jan 2019), the upper boundary of a minor ascending channel from 26 Aug 2019 and a Fibonacci expansion cluster.
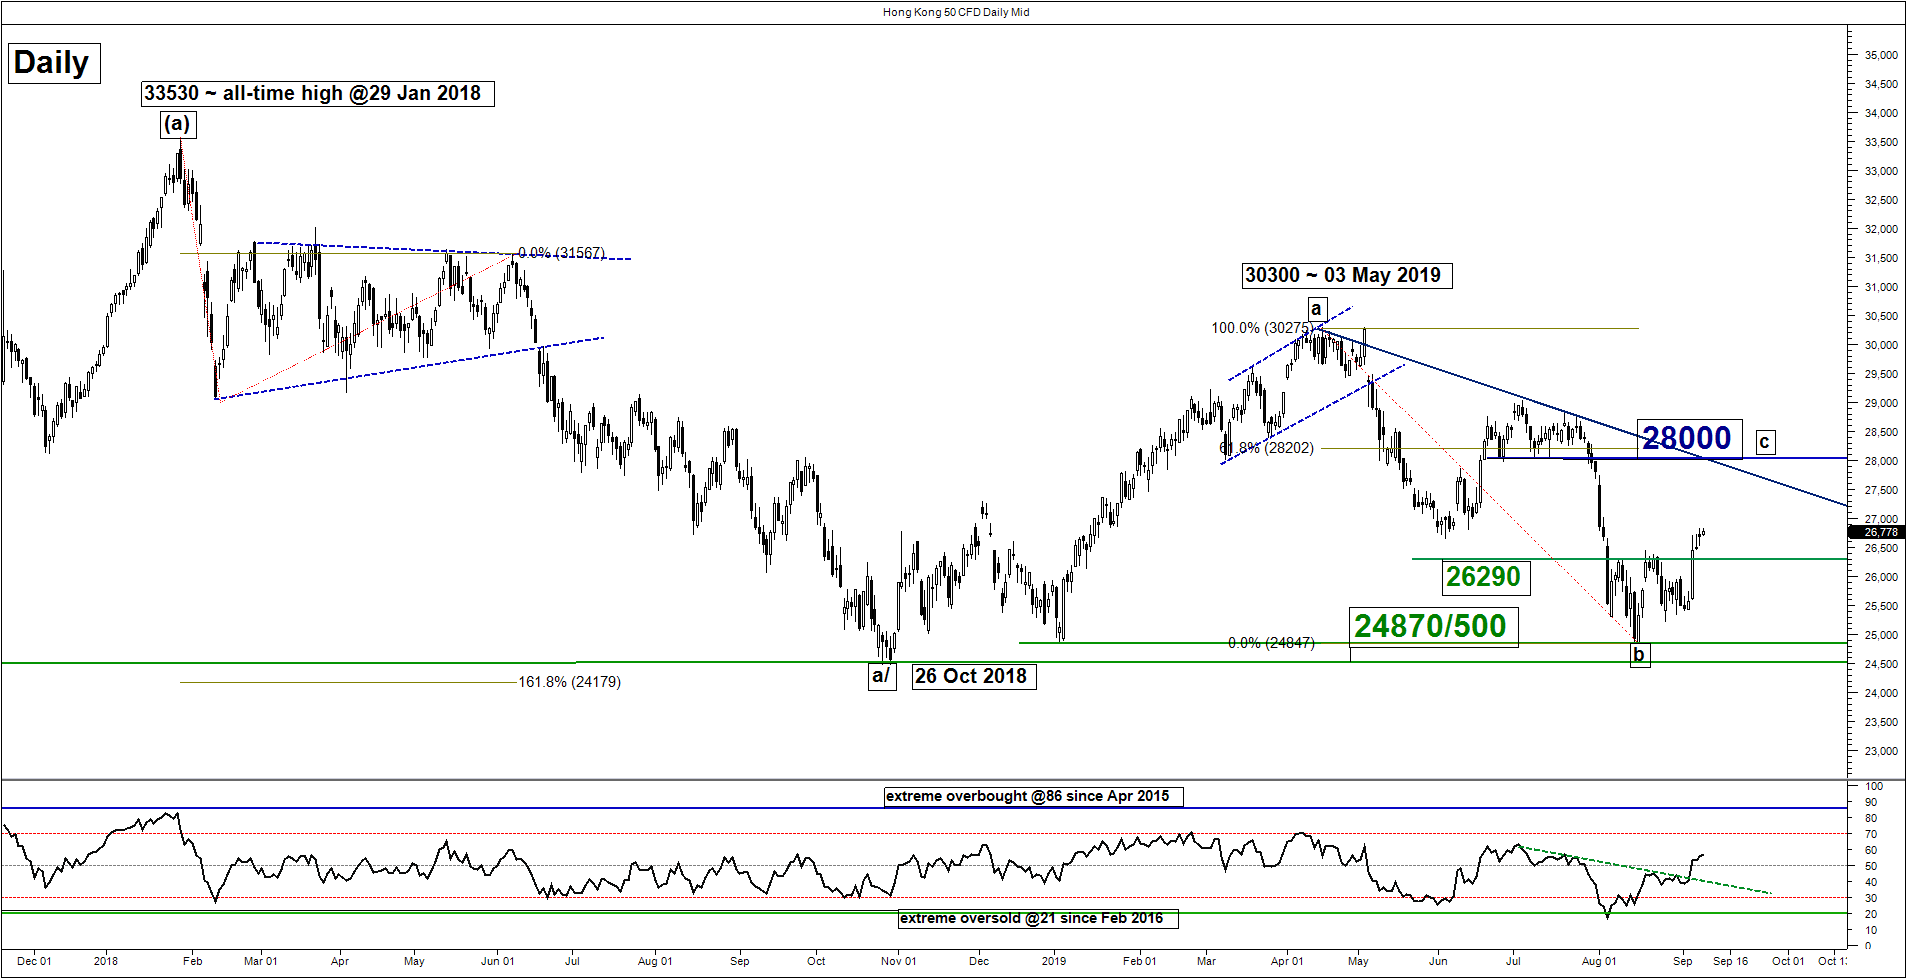
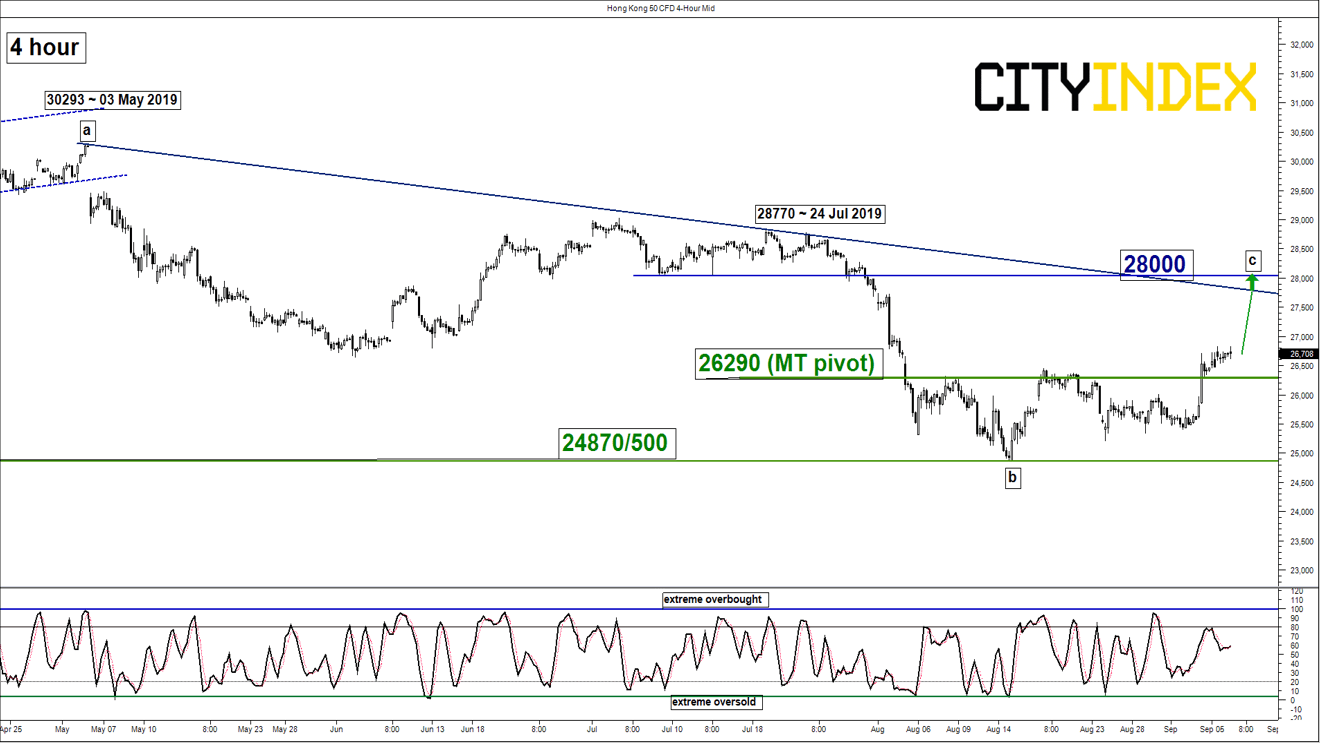
Hang Seng – Breaking above 26700
click to enlarge charts
Key Levels (1 to 3 weeks)
Pivot (key support): 26290
Resistance: 28000
Next support: 24870/500
Directional Bias (1 to 3 weeks)
The Hong Kong 50 Index (proxy for Hang Seng Index futures) has started to stage an attempt to break above 26700 (the former 05 Jun 2019 medium-term swing low) with a positive observation seen in the daily RSI oscillator that has staged a bullish breakout from a corresponding descending resistance.
Flip to a bullish bias in any dips above the 26290 key medium-term pivotal support for a mean reversion rebound to target the next resistance at 28000. On the other hand, a daily close below 26290 revives the bearish tone for a push back down to retest the major range support of 24870/500.
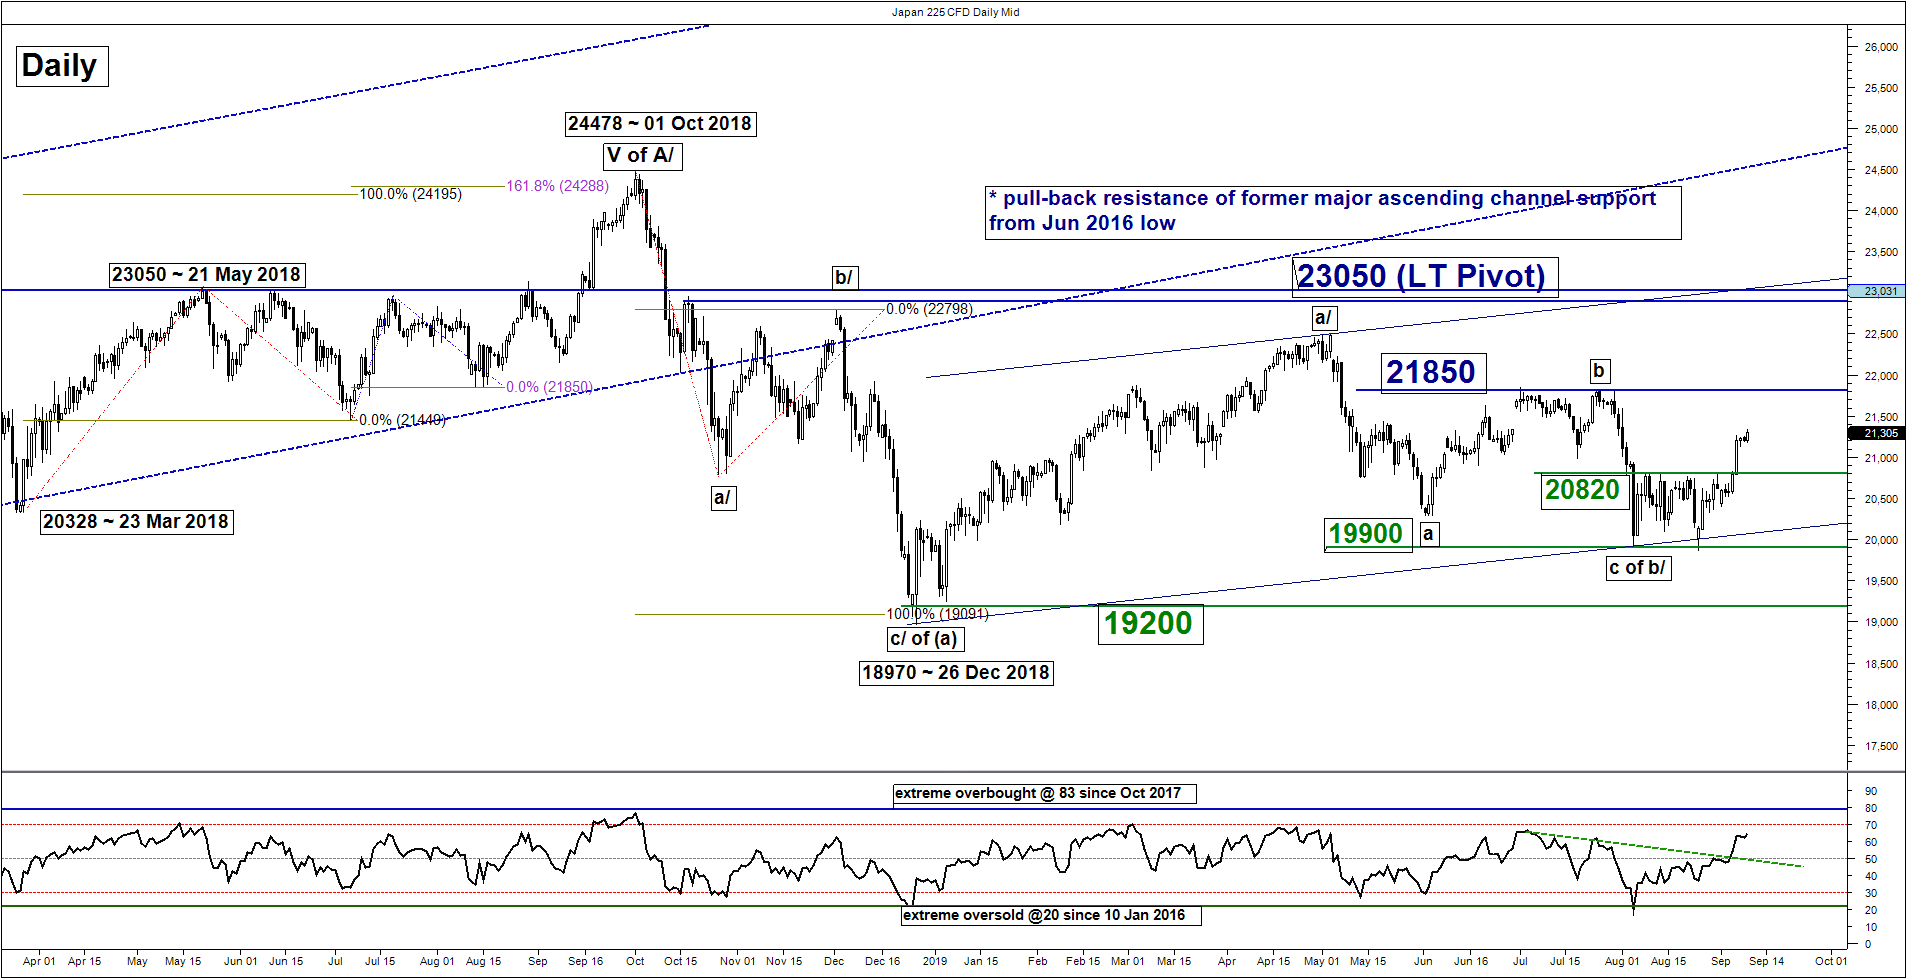
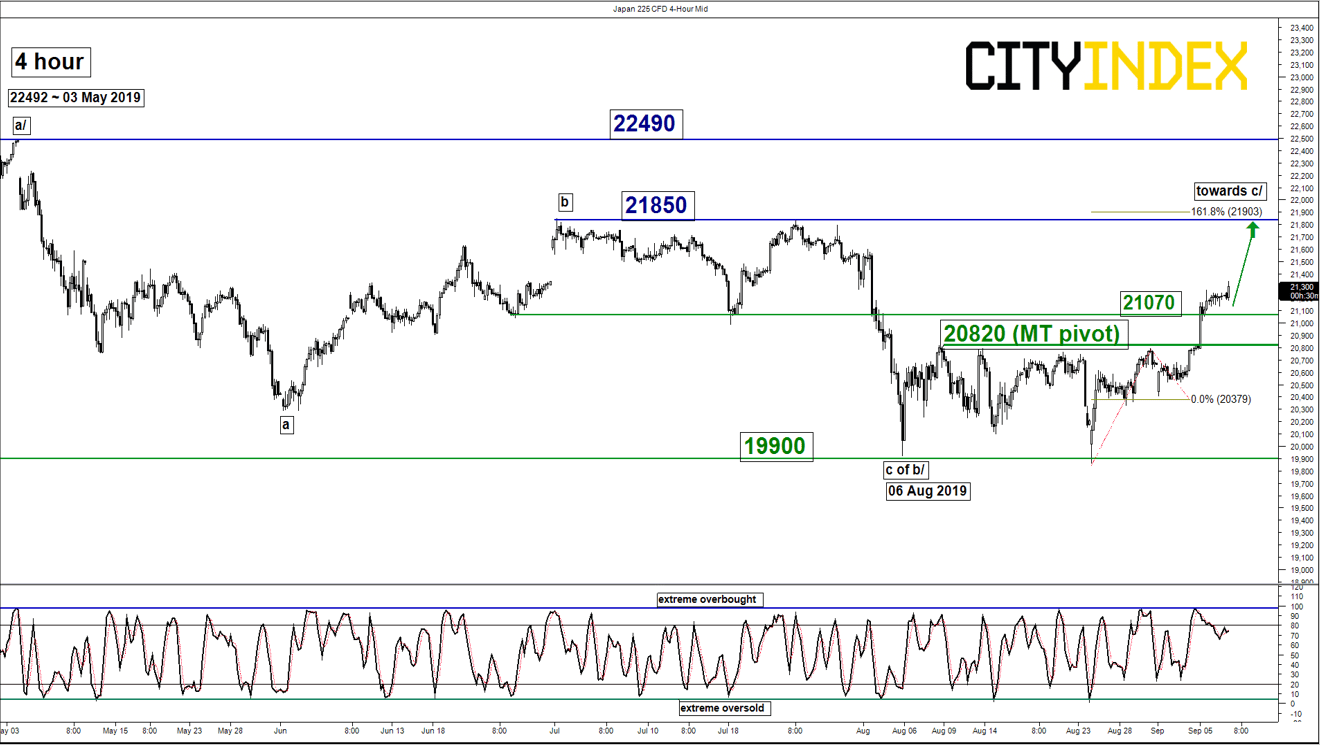
Nikkei 225 – Further up move within an ascending range
click to enlarge charts
Key Levels (1 to 3 weeks)
Intermediate support: 21070
Pivot (key support): 20820
Resistances: 21850 & 22490
Next support: 19900
Directional Bias (1 to 3 weeks)
The Japan 225 Index (proxy for the Nikkei 225 futures) has staged a bullish break from a 4-week range configuration in place since 06 Aug 2019 that has invalidated the preferred bearish scenario as per highlighted in our previous report.
Flip to a bullish bias in any dips above 20820 key medium-term pivotal support for a further potential push up to target the next resistance at 21850 with a maximum limit set at 22490 (03 May 2019 swing high). On the other hand, a daily close below 20820 suggests a failure bullish breakout for a choppy decline to retest the range support at 19900.
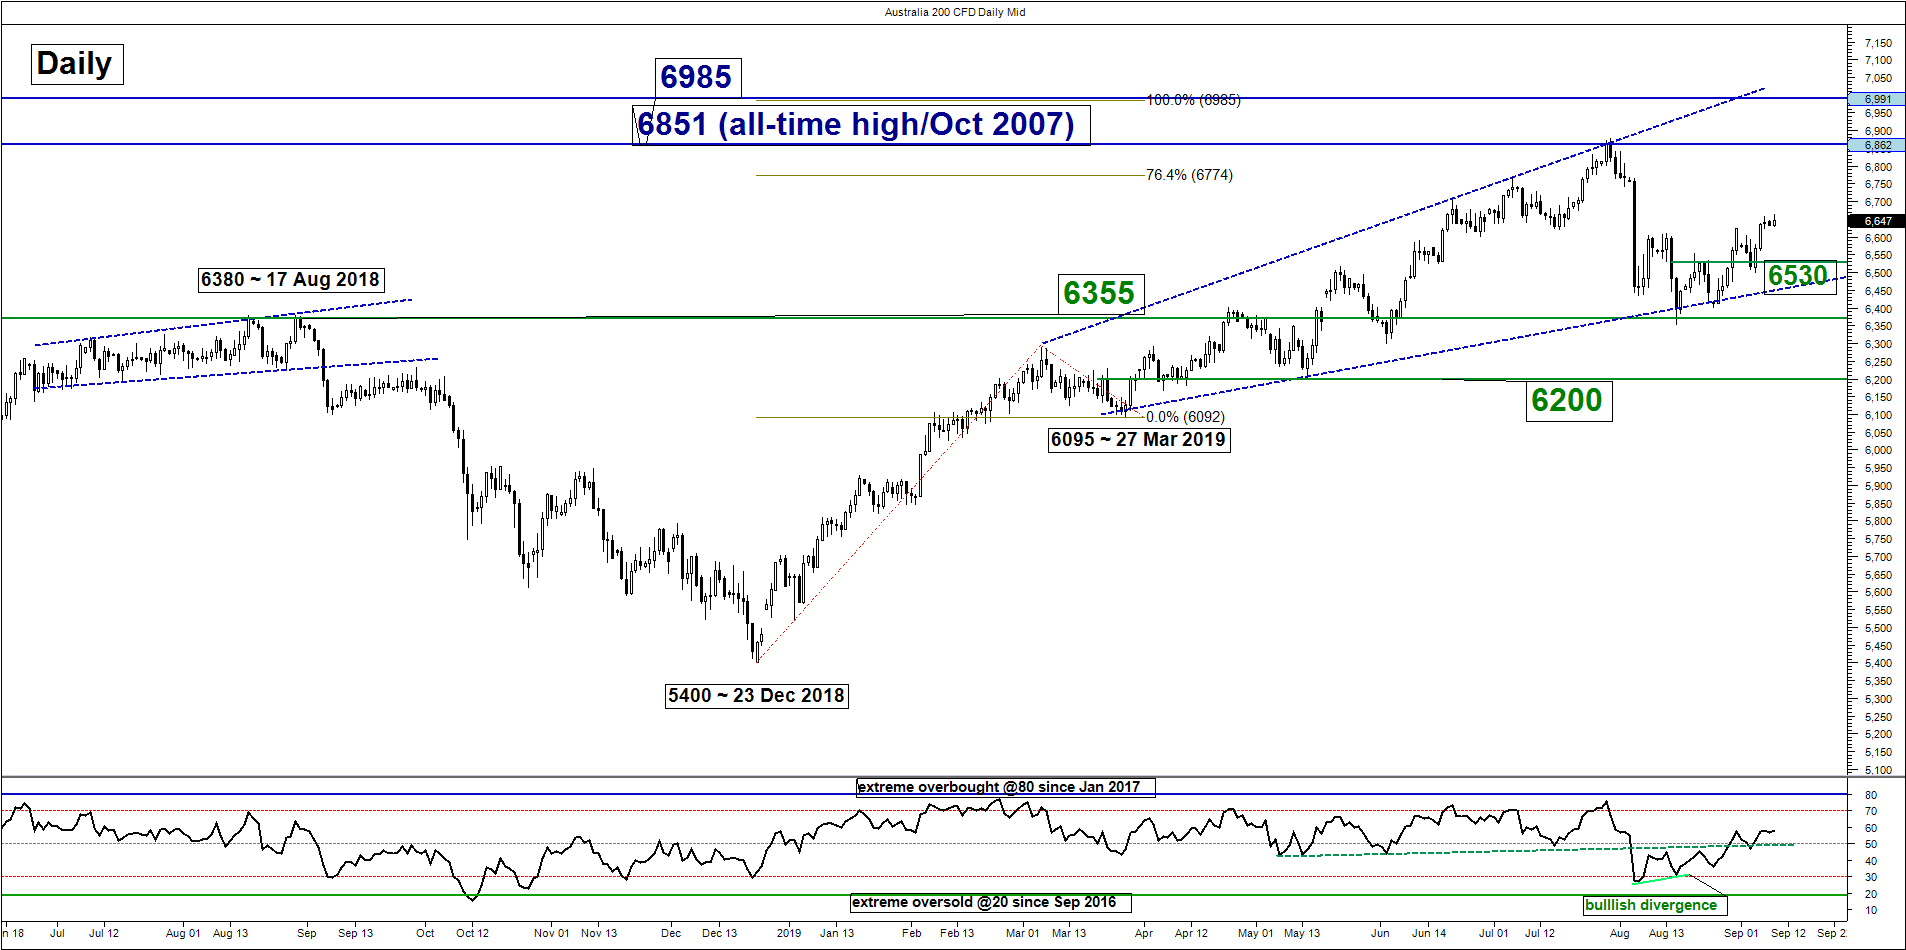
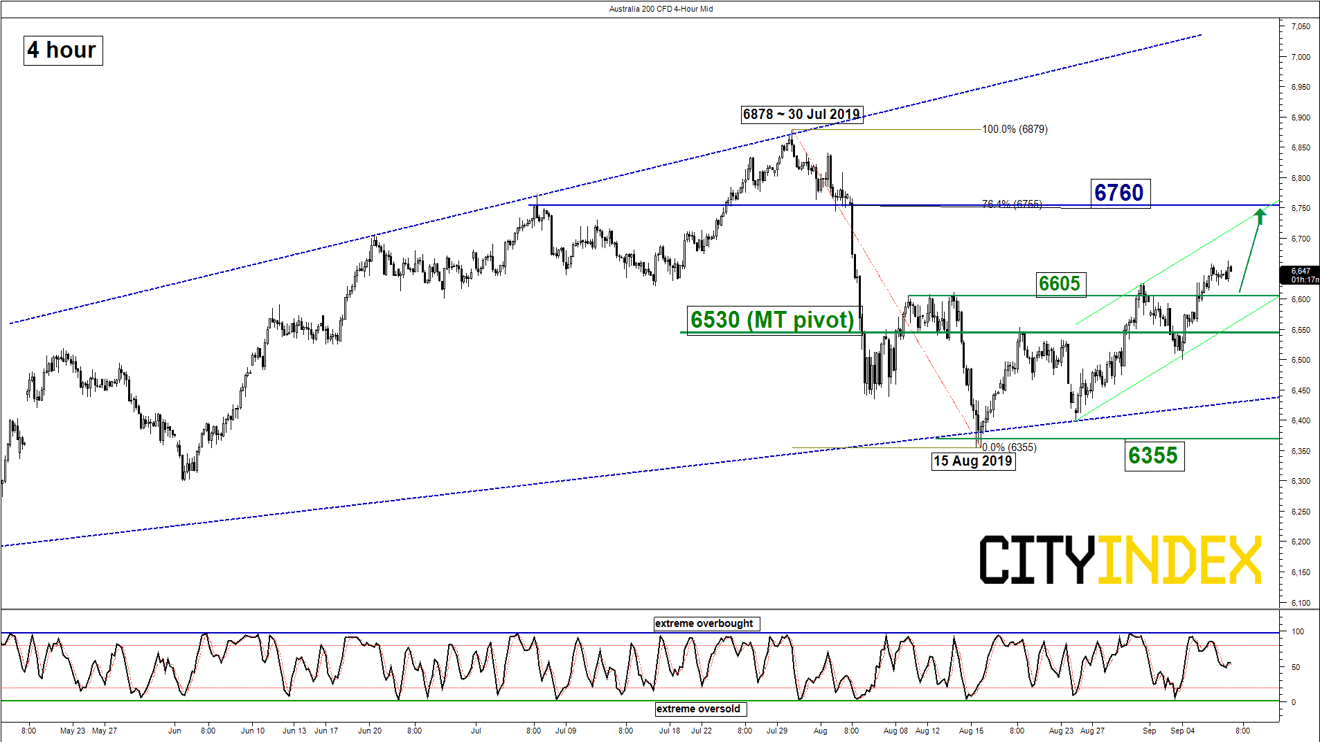
ASX 200 – Further push up above 6530
click to enlarge charts
Key Levels (1 to 3 weeks)
Intermediate support: 6605
Pivot (key support): 6530
Resistance: 6760
Next support: 6355
Directional Bias (1 to 3 weeks)
The Australia 200 Index (proxy for the ASX 200 futures) has cleared above the upper limit of the neutrality range at 6530 and validated a further up move.
In addition, the daily RSI oscillator remains positive above the 50 level which indicates a revival of medium-term upside momentum. We turn bullish in any dips above the 6530 key medium-term pivotal support for a further potential push up to target the 6760 resistance in the first step.
On the other hand, a daily close below 6530 negates the bullish tone a slide back to retest 6355 (15 Aug 2019 swing low & close to the lower boundary of an “Expanding Wedge” from 27 Mar 2019 low).
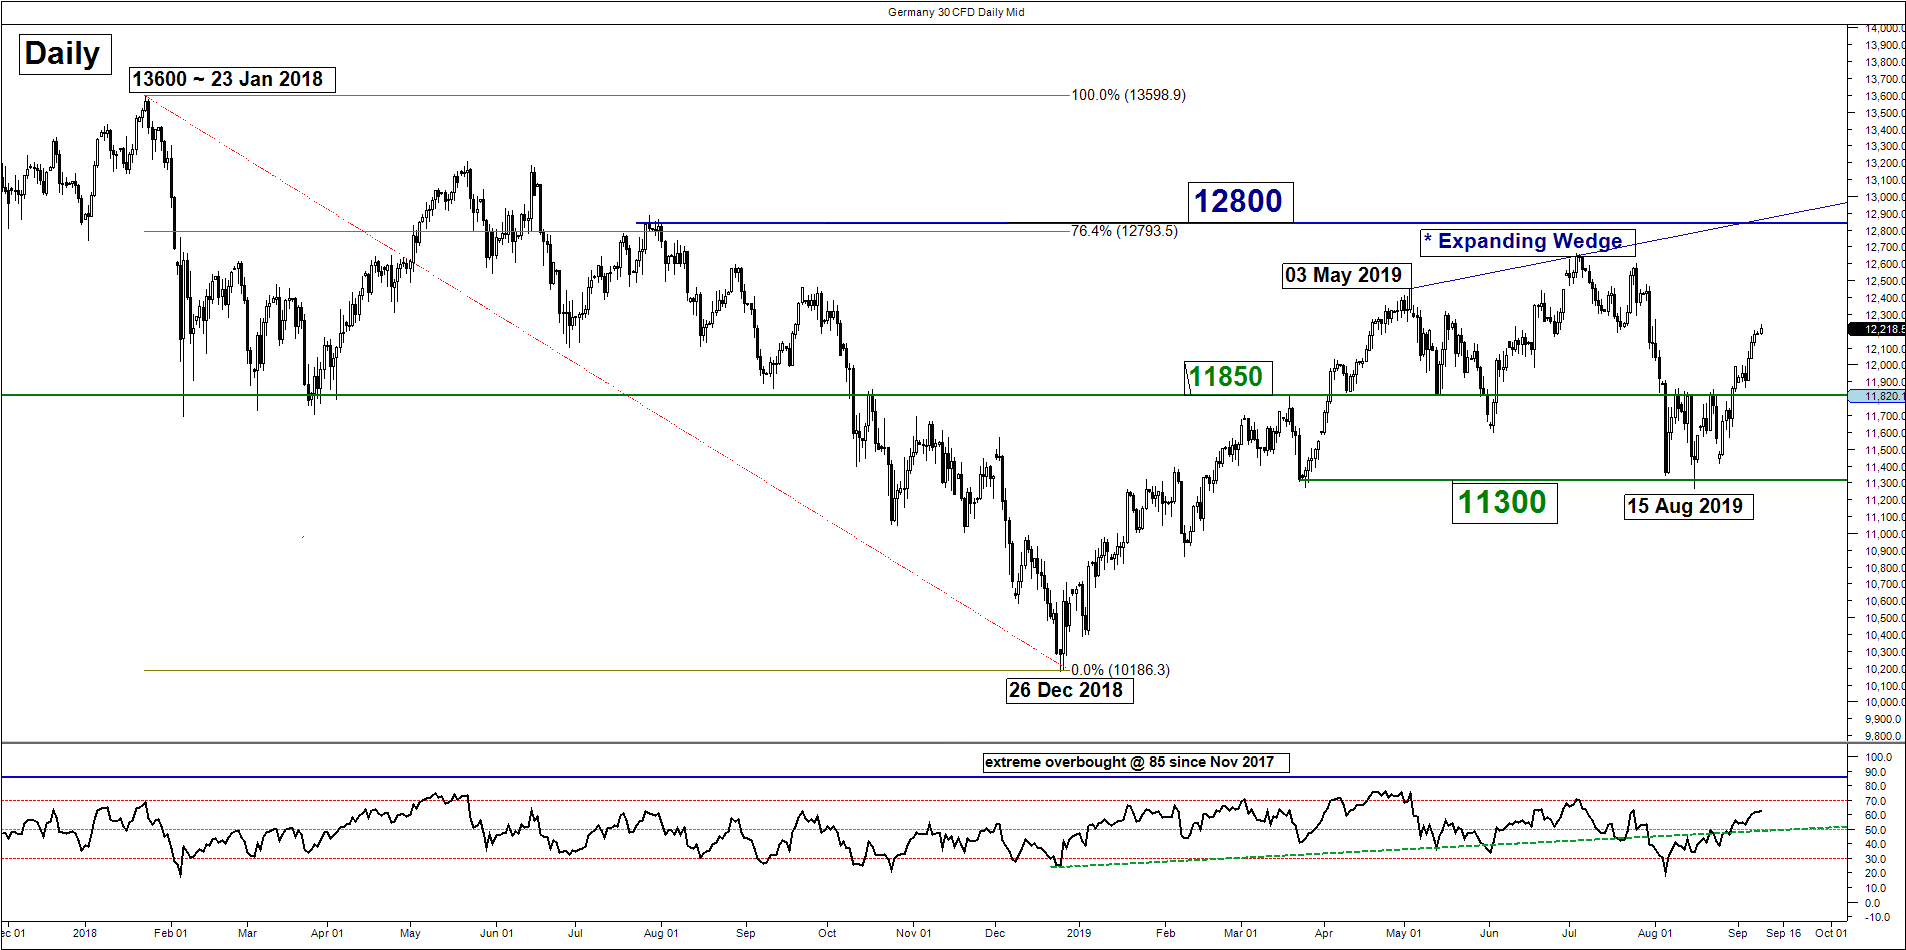
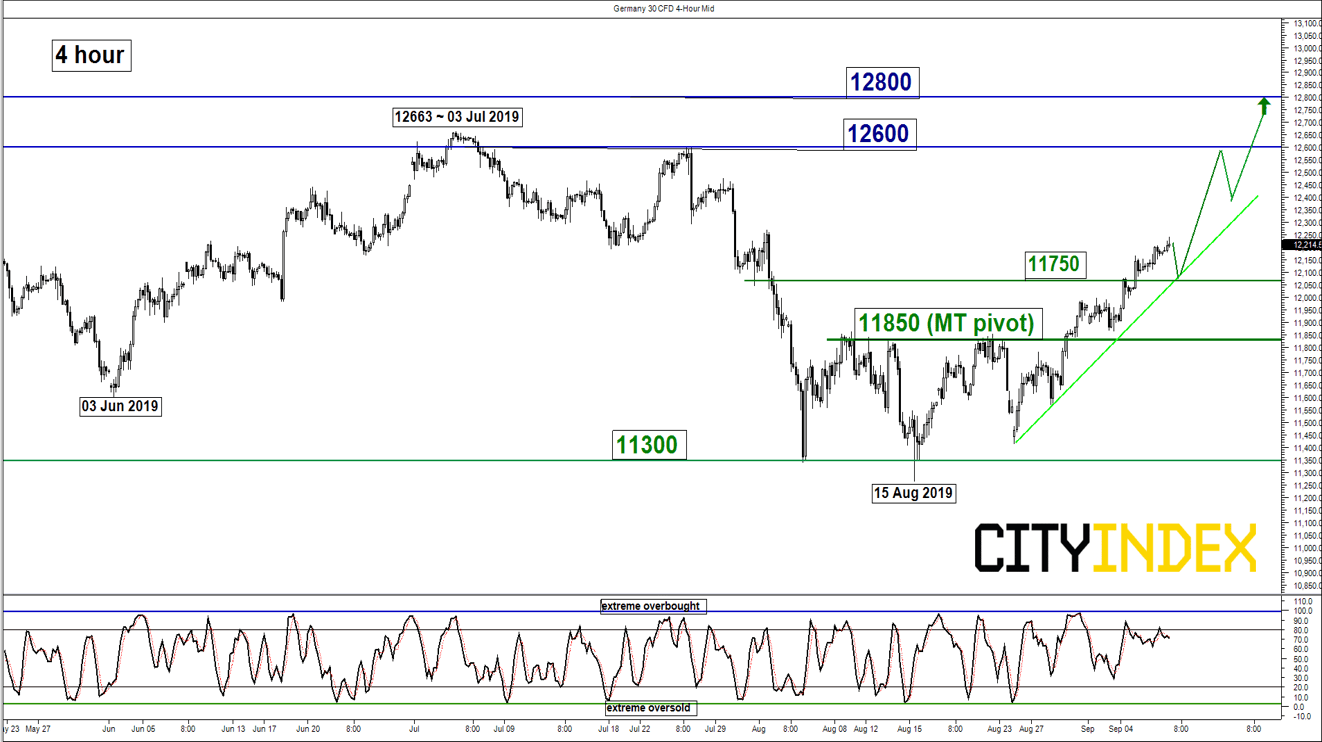
DAX – Further push up above 11850
click to enlarge charts
Key Levels (1 to 3 weeks)
Intermediate support: 11750
Pivot (key support): 11850
Resistances: 12600 & 12800
Next support: 11300
Directional Bias (1 to 3 weeks)
The Germany 30 Index (proxy for the DAX futures) has staged a bullish breakout from a 4-week range configuration in place since 06 Aug 2019. In addition, the daily RSI oscillator has turned bullish above the 50 level which indicates that medium-term upside momentum has resurfaced.
We turn bullish in any dips above the 11850 key medium-term pivotal resistance for a further potential push up to target 12600 follow by 12800 next (upper limit of the “Expanding Wedge” & 76.4% Fibonacci retracement of the previous down move from 23 Jan high to 26 Dec 2018 low).
On the other hand, a daily close below 11850 negates the bullish tone for a slide back to retest the 11300 range support.
Charts are from City Index Advantage TraderPro
Latest market news
Latest Indices articles

April 17, 2024 11:00 AM
April 16, 2024 08:00 PM
April 16, 2024 04:54 PM