


S&P 500 – Still at risk of forming medium-term top
click to enlarge charts
Key Levels (1 to 3 weeks)
Pivot (key resistance): 3020/28 (excess)
Supports: 2957 (trigger), 2910/04 & 2875
Next resistance: 3060/88 (Fibonacci expansion)
Medium-term (1 to 3 weeks) Outlook
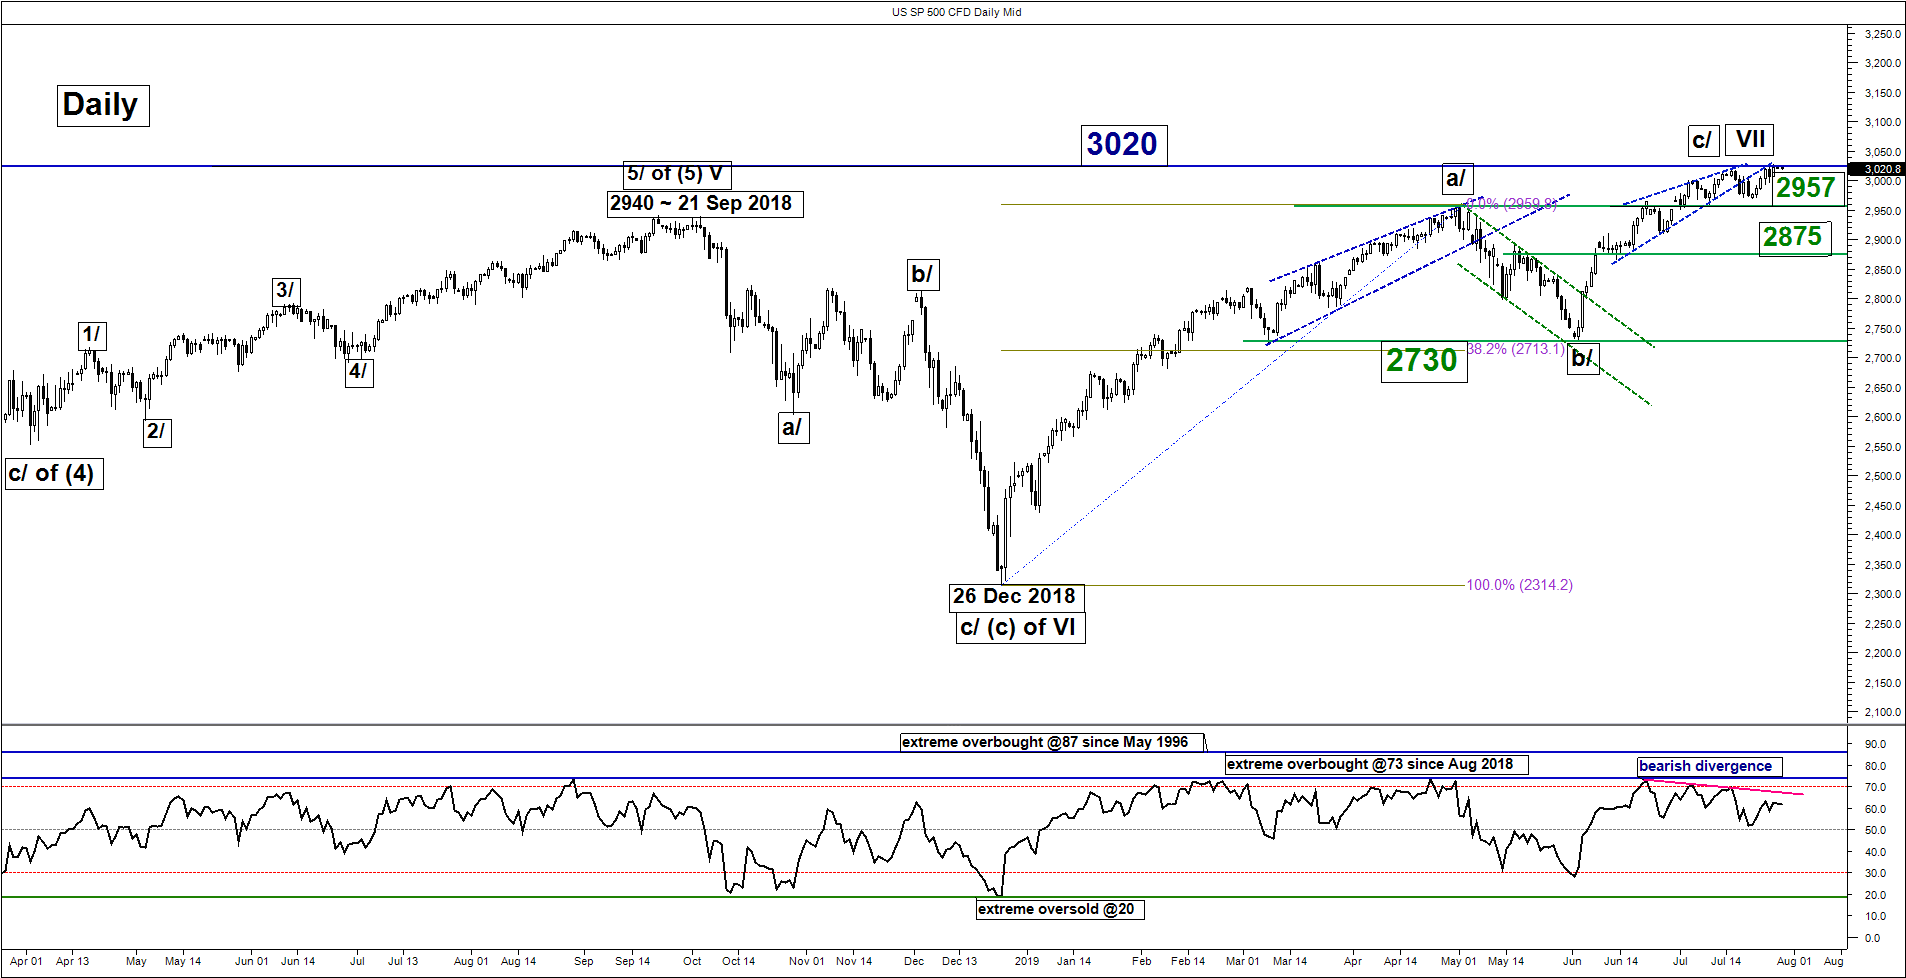
The SP 500 Index (proxy for the S&P 500 futures) has inched higher last week; made another fresh all-time high and challenged the 3020 key medium-term pivotal resistance as per highlighted in our previous weekly outlook report (click here for a recap).
It printed a new record intraday all-time high of 3028 on last Fri, 26 Jul before it traded back down towards 3020 in today, 29 Jul Asian session. In addition, key technical elements remain negative.
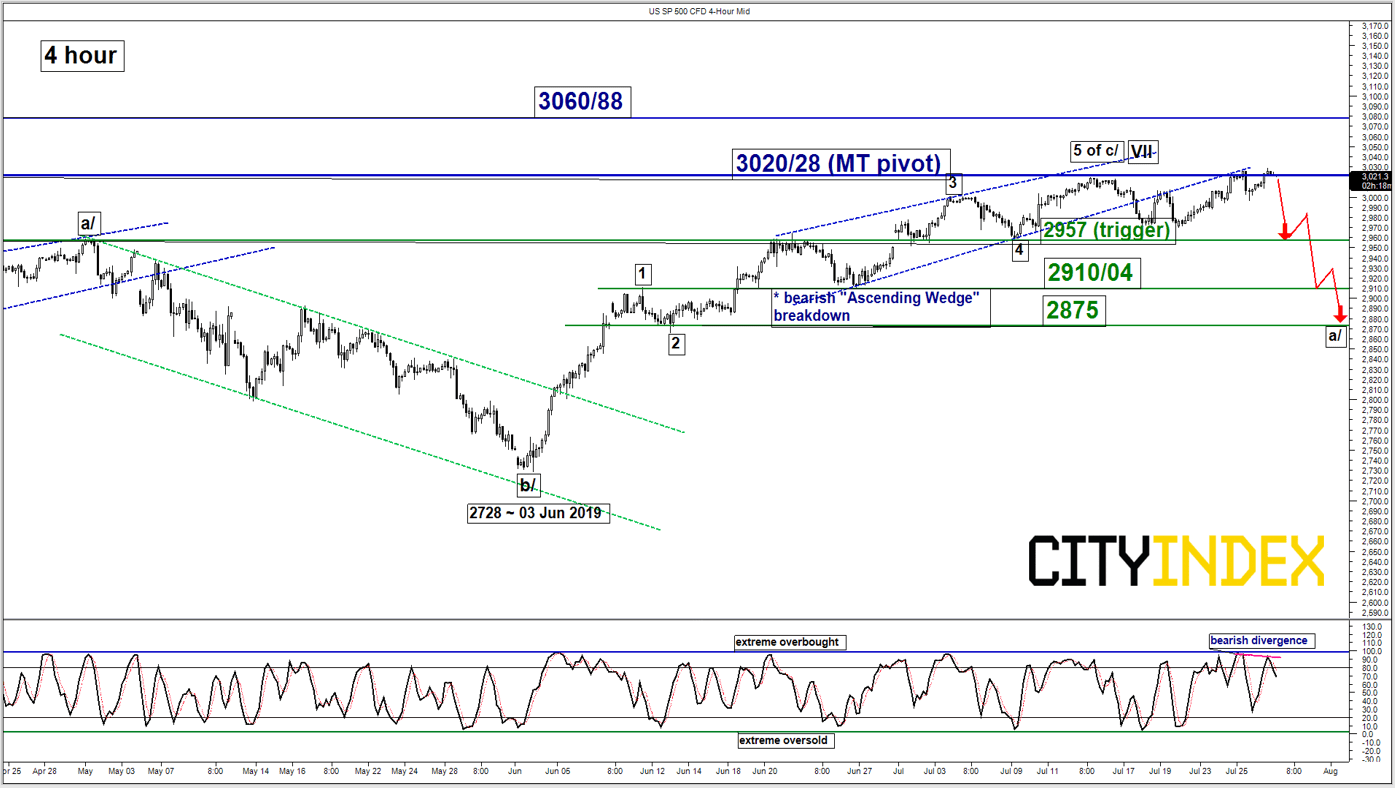
- Upside momentum has continued to wane where the bearish divergence signal seen in the daily RSI oscillator remains intact since 05 Jul 2019 coupled with weakness seen in the shorter-term 4-hour Stochastic oscillator as it has flashed a bearish divergence signal late last week at its extreme overbought level.
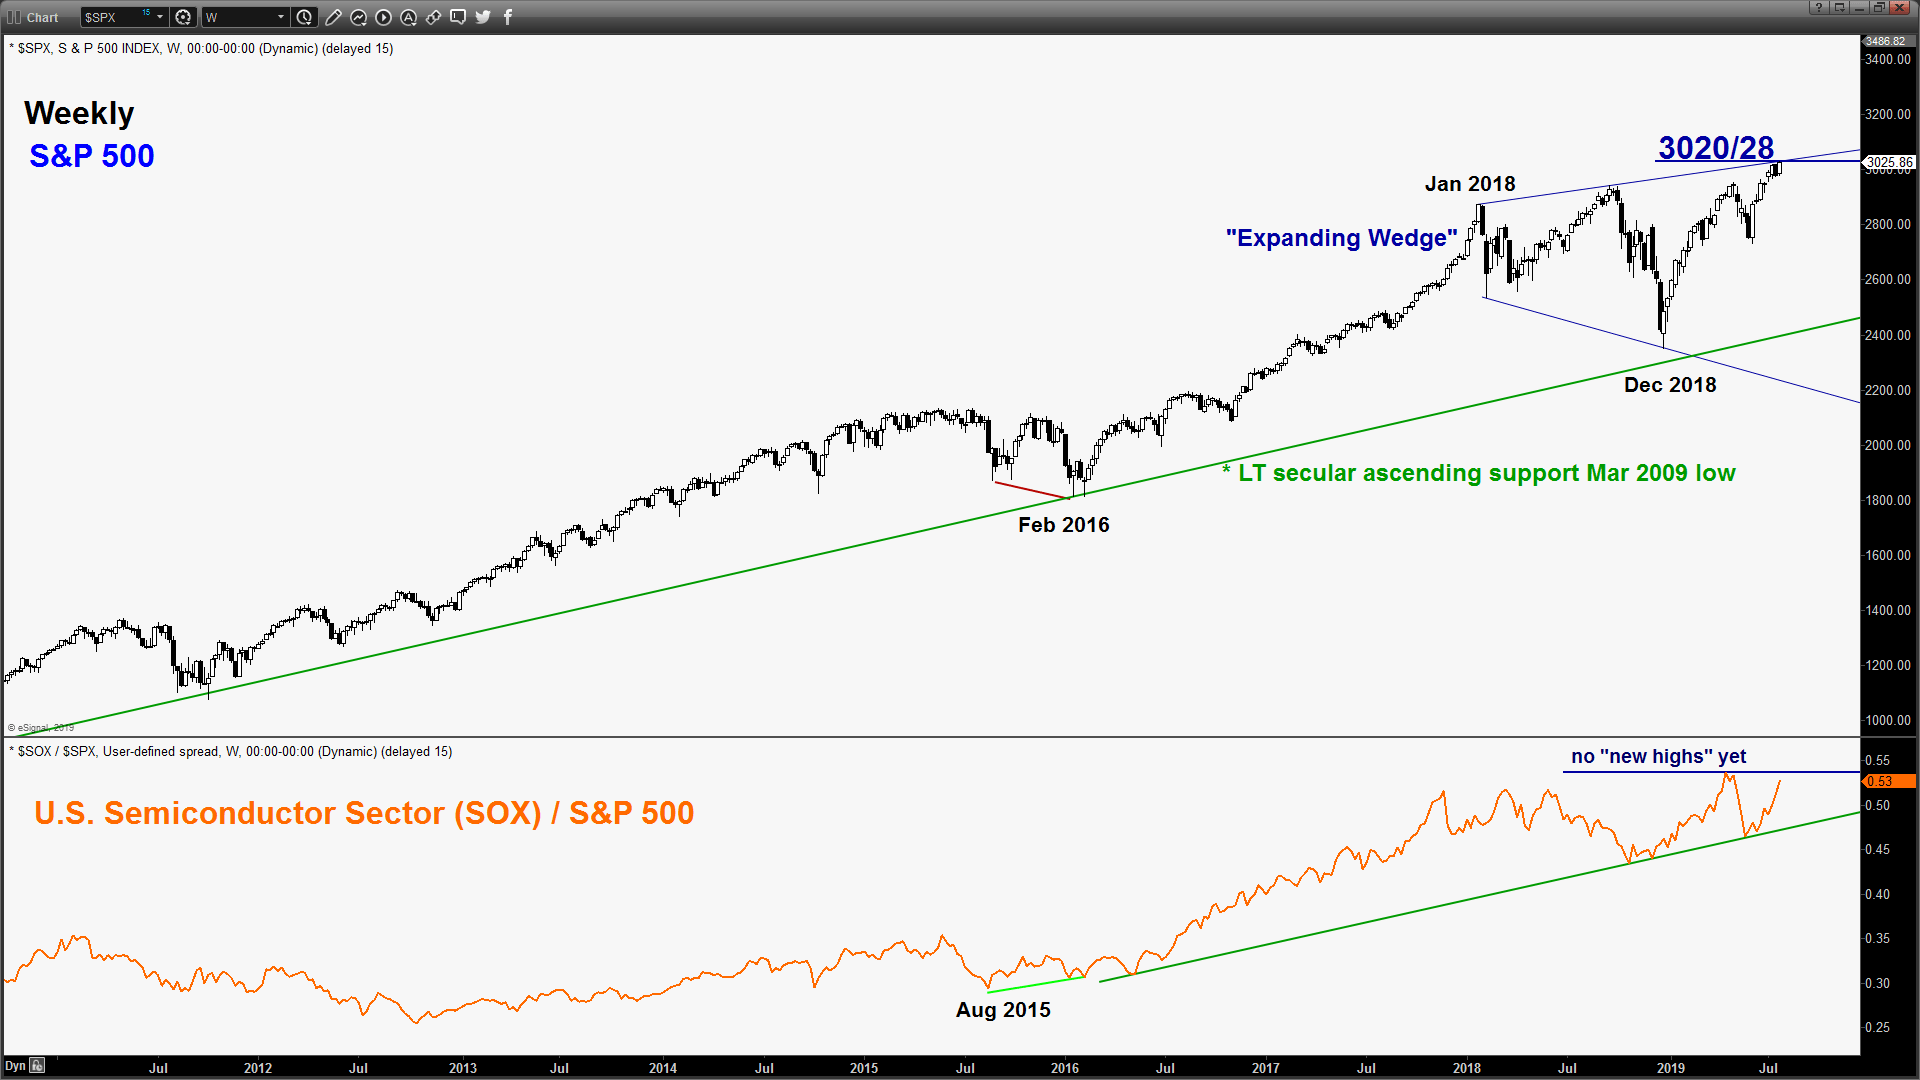
- One of the main catalysts that drives the S&P 500 to record new high last week was the better than expected earnings release and “not so worrisome revenue guidance” from a bellwether semiconductor stock, Texas Instrument. However, the relative strength chart of the semiconductor sector versus the S&P 500 has not broken above its previous high.
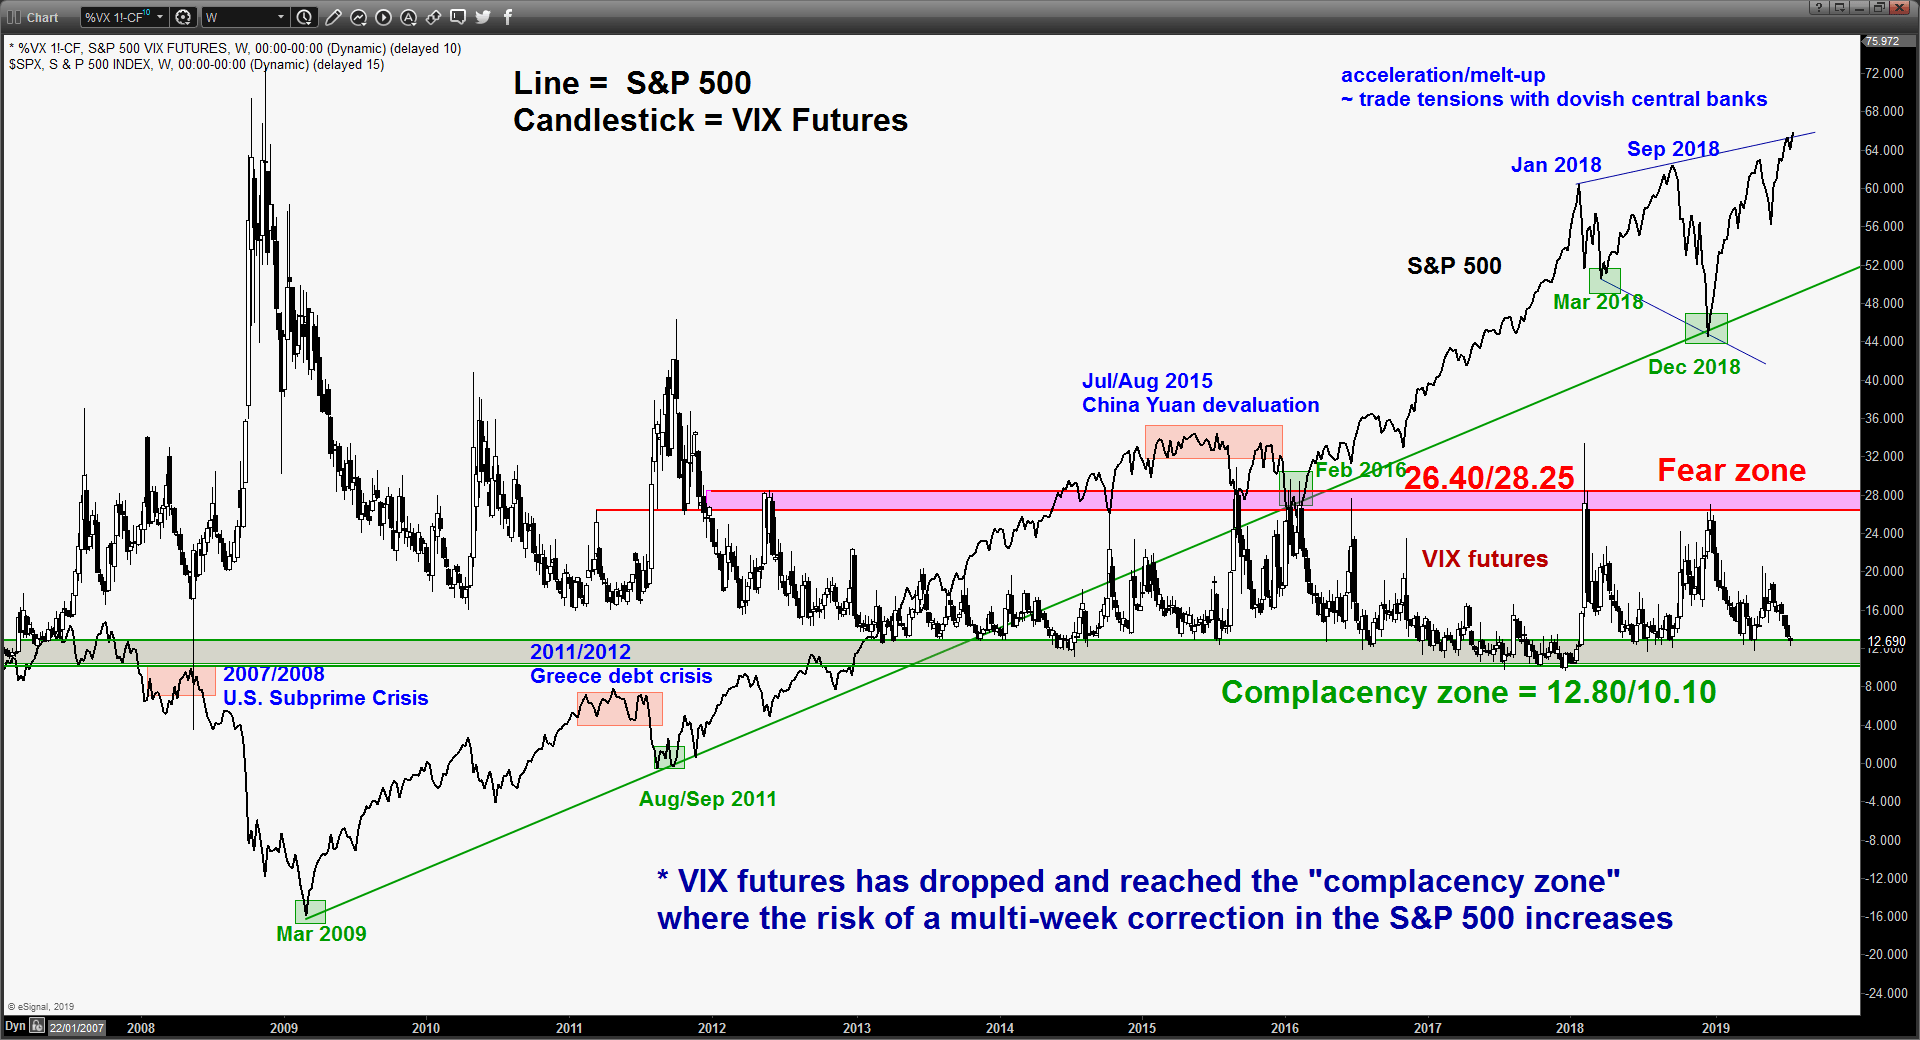
- From a contrarian opinion perspective, the VIX futures has managed to stage a bounce last Fri, 26 Jul at the upper limit of it “complacency zone” of 12.80/10.10. Therefore, the risk of a of a multi-week corrective decline in the S&P 500 still prevails.
Therefore, we maintain the bearish bias and tolerate the excess to 3028 and added a downside trigger level at 2957. A break with an hourly close below 2957 reinforces the potential corrective down move to target the 2910/04 support follow by 2875 next (also the 50% Fibonacci retracement of the recent up move from 03 Jun low to 27 Jul 2019 high).
On the other hand, a clearance with a daily close above 3028 invalidates the bearish scenario for a squeeze up towards the next resistance at 3060/88.
Nikkei 225 – Retreated below 21900/222000 key range resistance
click to enlarge charts
Key Levels (1 to 3 weeks)
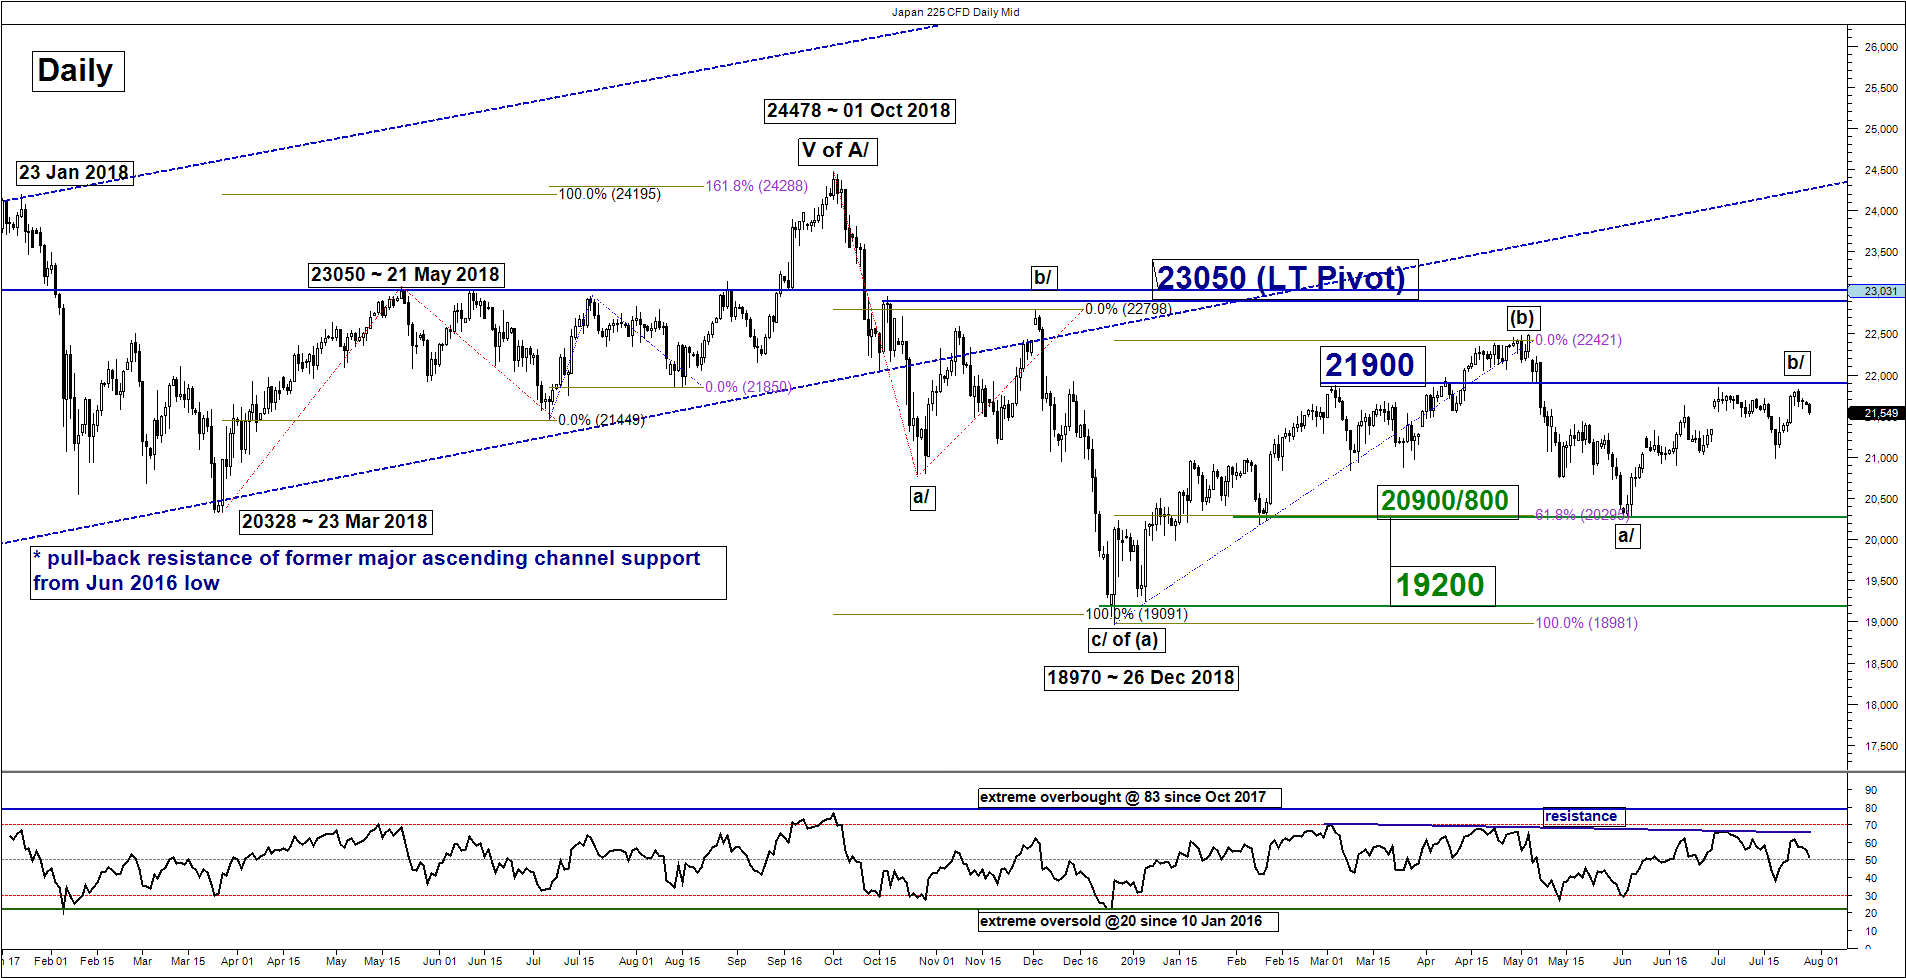
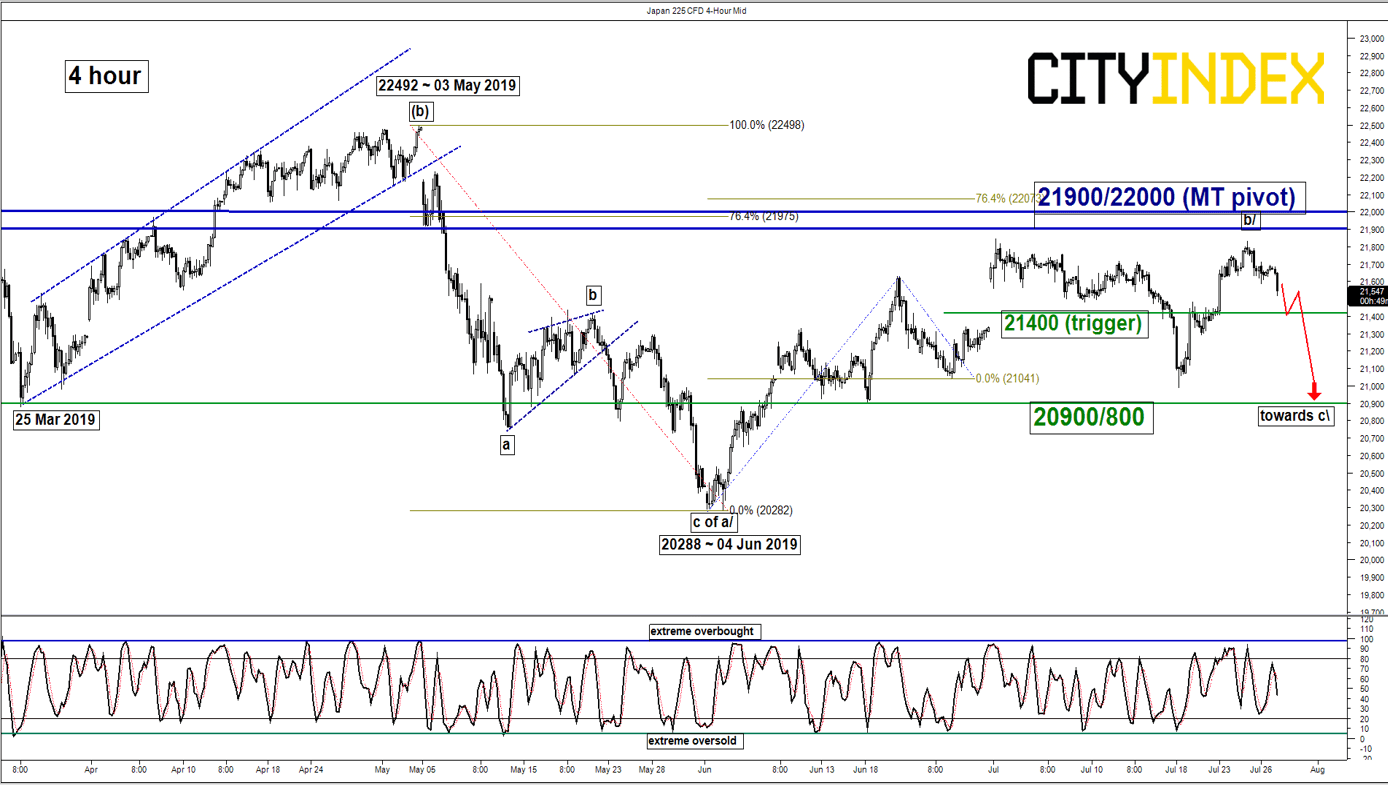
Pivot (key resistance): 21900/22000
Support: 21400 (trigger) & 20900/800
Next resistance: 23050 (LT pivot)
Medium-term (1 to 3 weeks) Outlook
The Japan 225 Index (proxy for the Nikkei 225 futures) has staged a squeezed on last week to print a high of 21830 on Thurs, 25 Jul.
Interestingly, the Index has started to retreat by -1.43% from last Thurs, 25 Jul high of 21830 which is right below the 21900/22000 key medium-term range resistance. Therefore, we maintain the bearish bias and ended 21400 as the downside trigger level. A break with an hourly close below 21400 is likely to see another corrective decline towards the next support at 20900/800 in the first step within a complex range configuration.
On the other hand, a clearance with a daily close above 22000 invalidates the bearish scenario for a further push up to challenge the 23050 long-term pivotal resistance set for Q3 2019.
Hang Seng – Further potential corrective decline validated
click to enlarge charts
Key Levels (1 to 3 weeks)
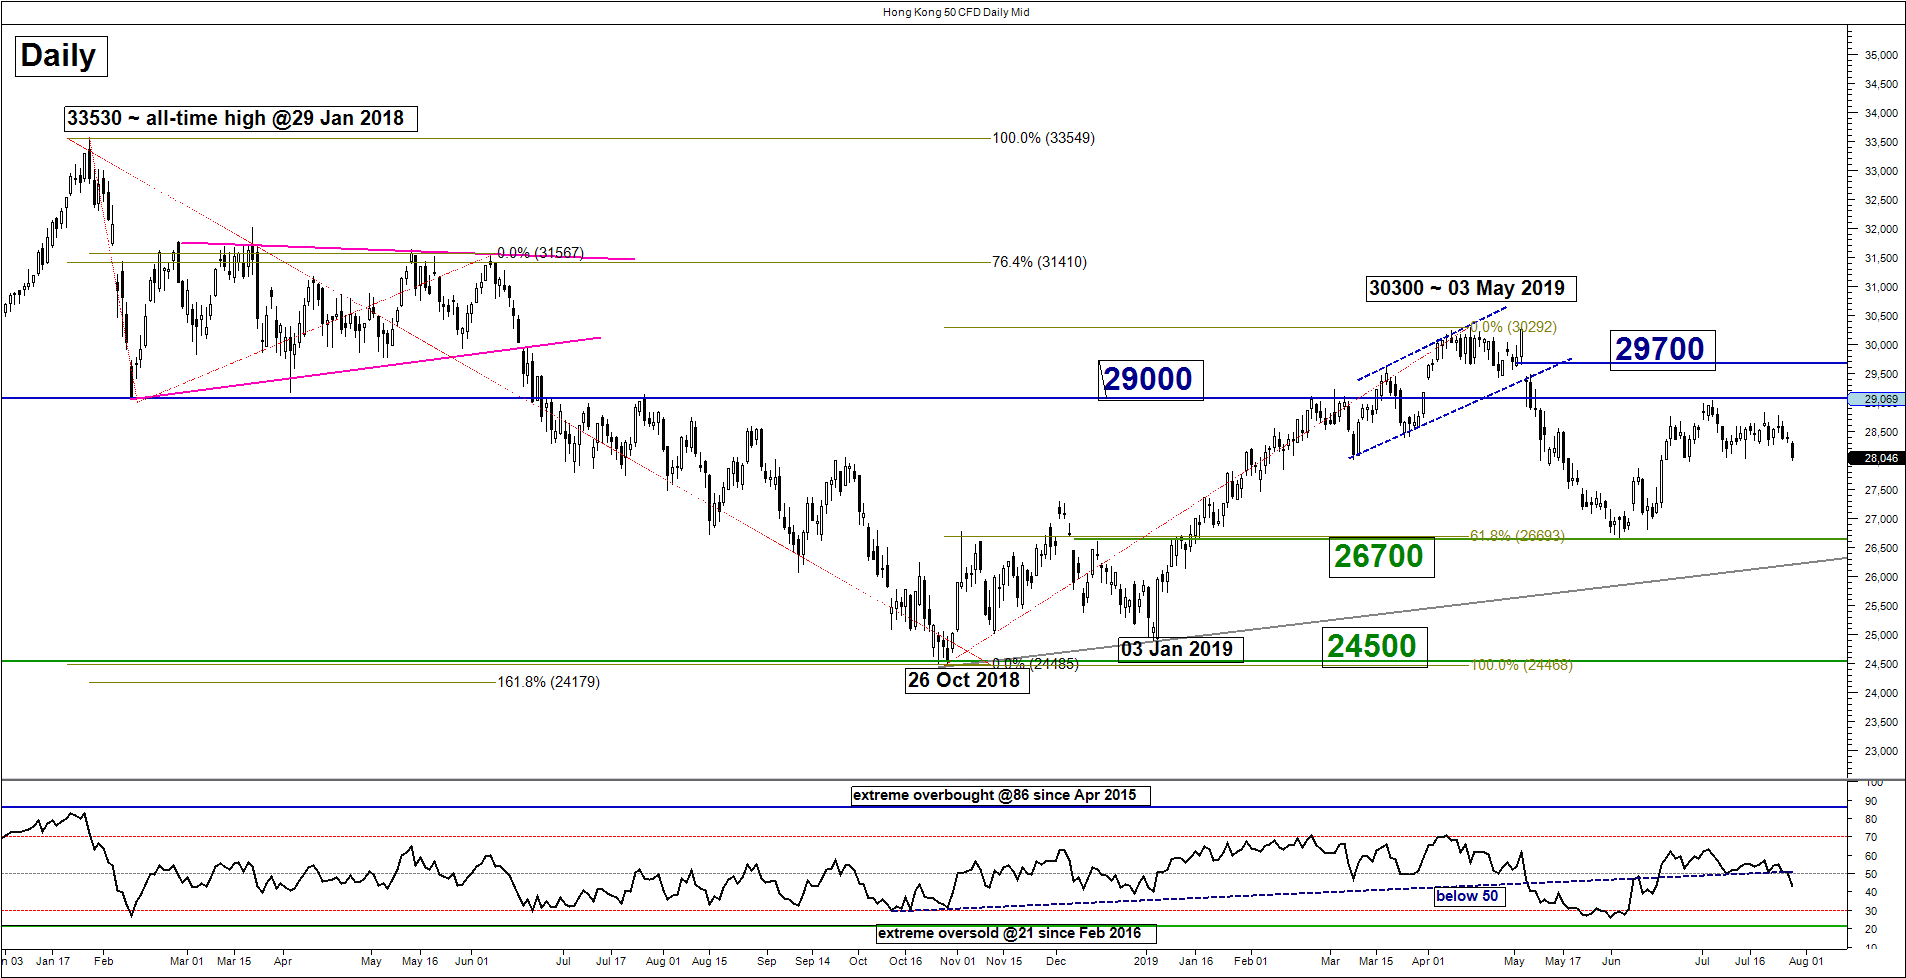
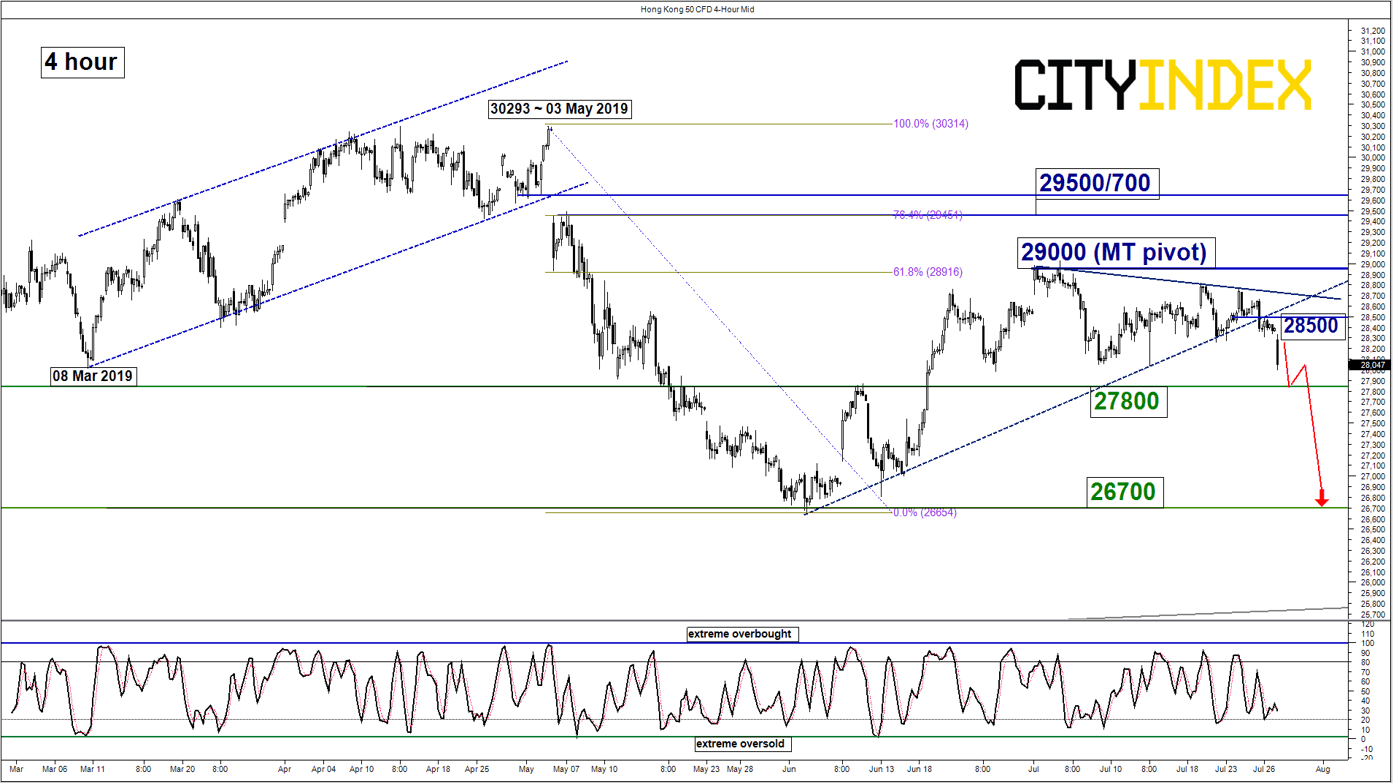
Intermediate resistance: 28500
Pivot (key resistance): 29000
Supports: 27800 & 26700
Next resistance: 29500/700
Medium-term (1 to 3 weeks) Outlook
The Hong Kong 50 Index (proxy for Hang Seng Index futures) has staged the bearish breakdown below 28300 (the lower limit of the neutrality range as per highlighted in our previous report).
We flip back to a bearish bias in any bounces below the 29000 key medium-term pivotal resistance for a further potential push down to target the next supports at 27800 and 26700 within a multi-week corrective decline sequence in place since 19 Jul 2019 high.
On the other hand, a clearance with a daily close above 29000 invalidates the bearish scenario for a squeeze up to target 29500/700 next.
ASX 200 – At risk of a multi-week corrective decline
click to enlarge charts
Key Levels (1 to 3 weeks)
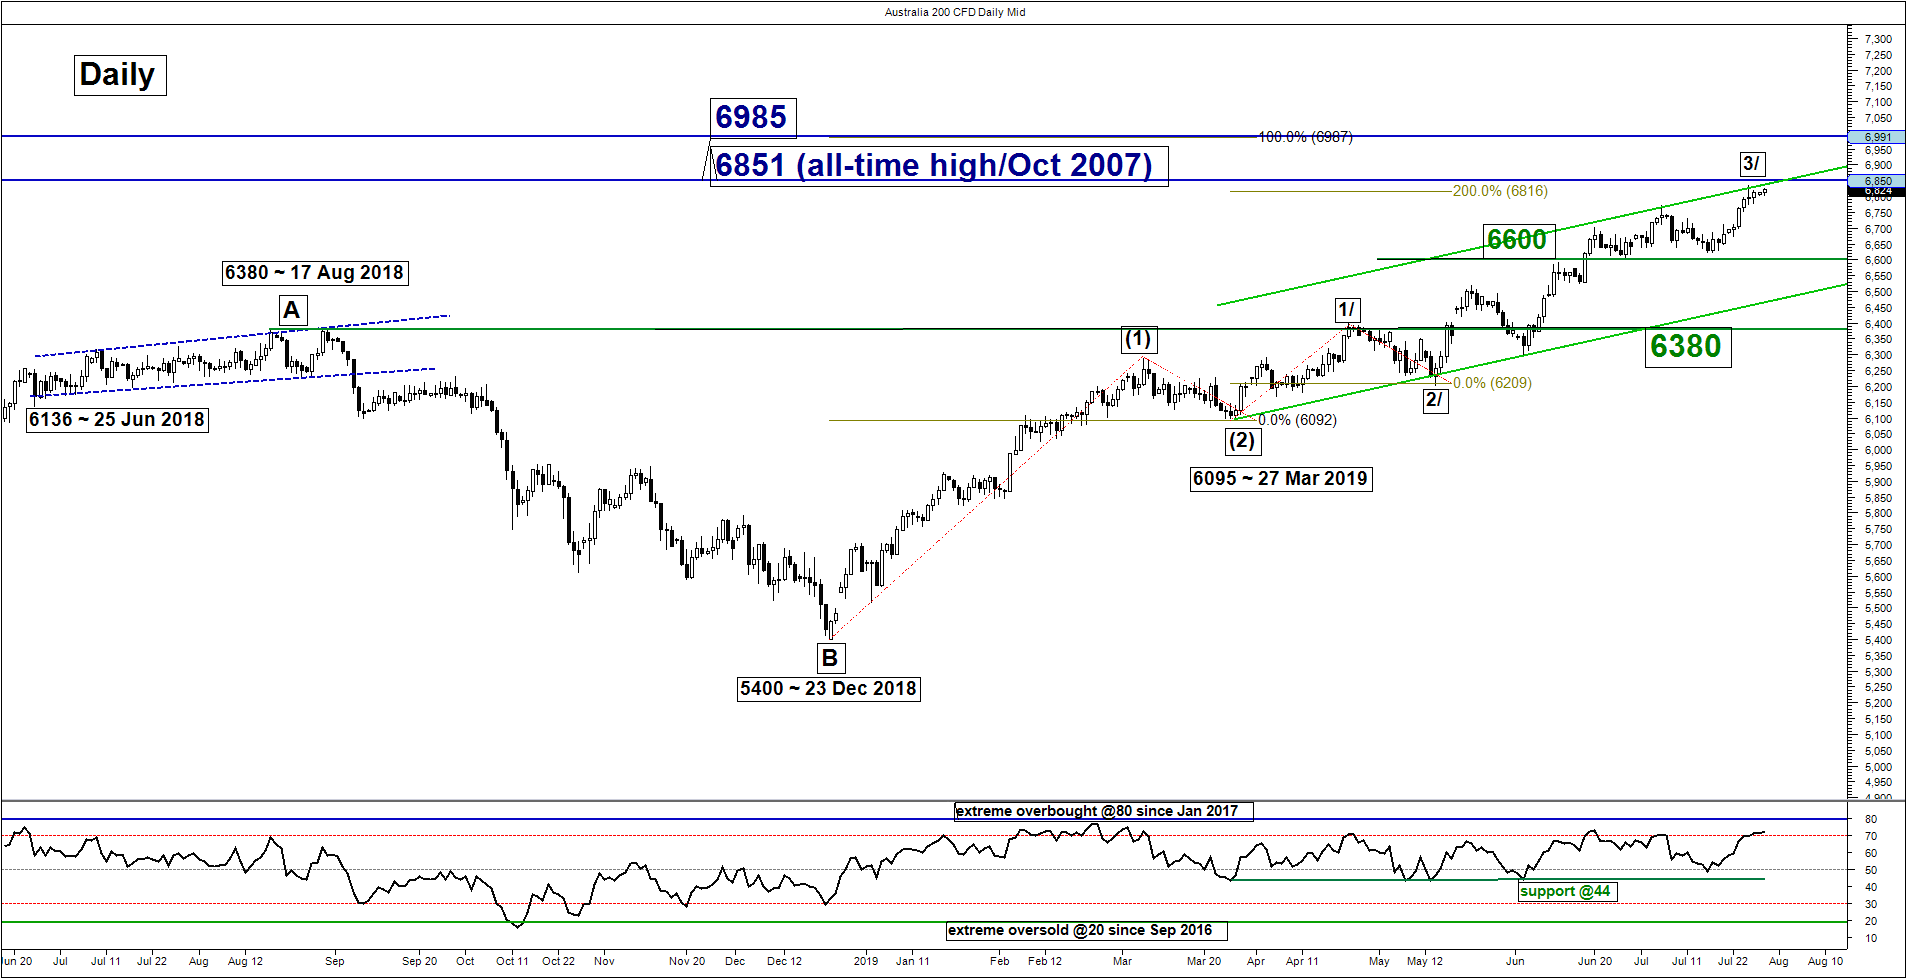
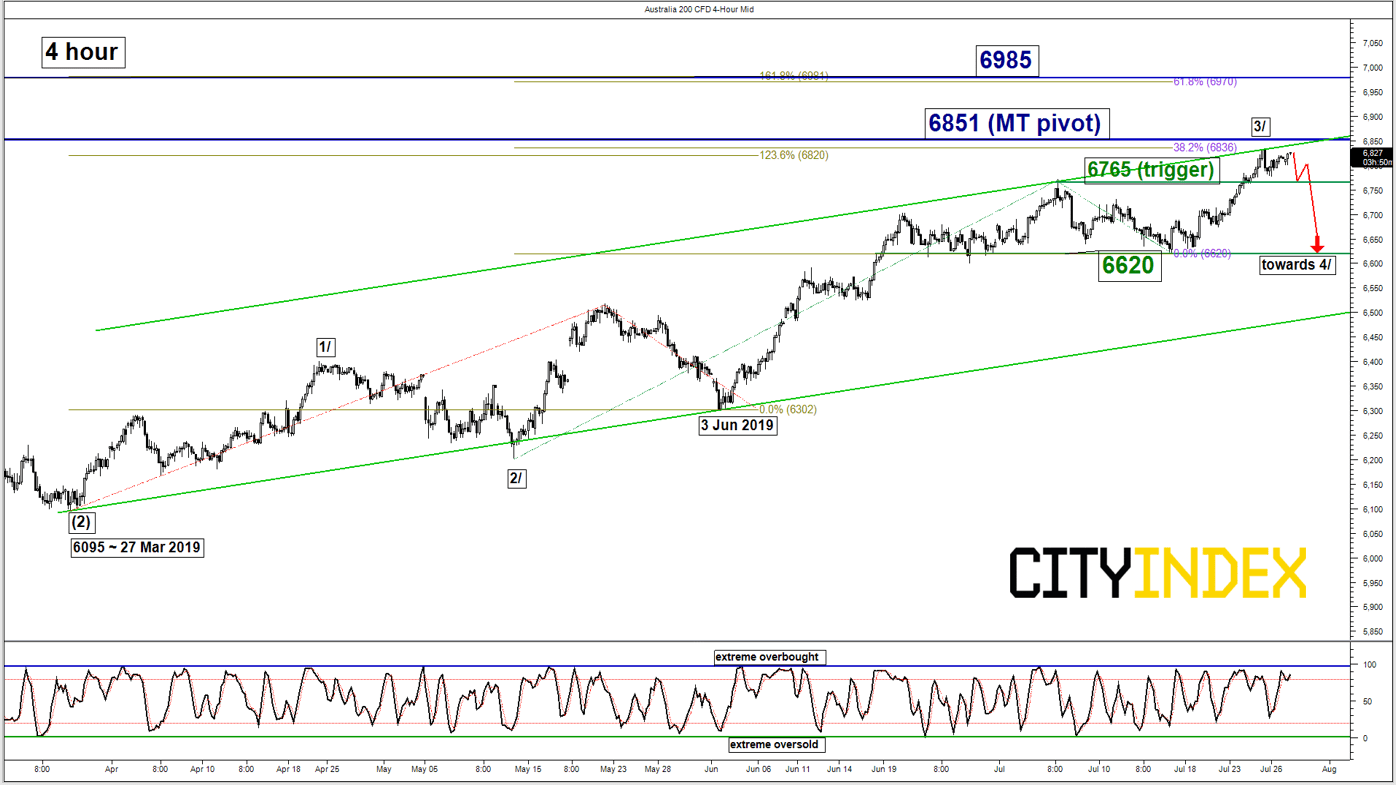
Pivot (key resistance): 6851
Supports: 6765 (trigger) & 6620
Next resistance: 6985 (Fibonacci expansion cluster)
Medium-term (1 to 3 weeks) Outlook
The Australia 200 Index (proxy for the ASX 200 futures) has staged the expected rally and hit the lower limit of the 6815/50 target/resistance zone as per highlighted in our previous report.
Both the daily RSI and 4-hour Stochastic oscillators are coming close to their respective extreme overbought levels with the price action of the Index right below the upper boundary of a medium-term ascending channel in place since 27 Mar 2019 low.
Also, Elliot Wave/fractal analysis suggests that the intermediate degree impulsive up move sequence, wave 3/ in place since 14 May 2019 low of 6203 may have ended where a potential multi-week corrective decline wave 4/ sequence should unfold next.
Therefore, we flip to a bearish bias below the 6851 key medium-term pivotal resistance and an hourly close below 6765 is likely to reinforce a corrective decline to target the next support at 6620.
On the other hand, a clearance with a daily close above 6851 invalidates the bearish scenario to see an extended impulsive up move towards 6985.
DAX – Mix elements; sideways
click to enlarge charts
Key Levels (1 to 3 weeks)
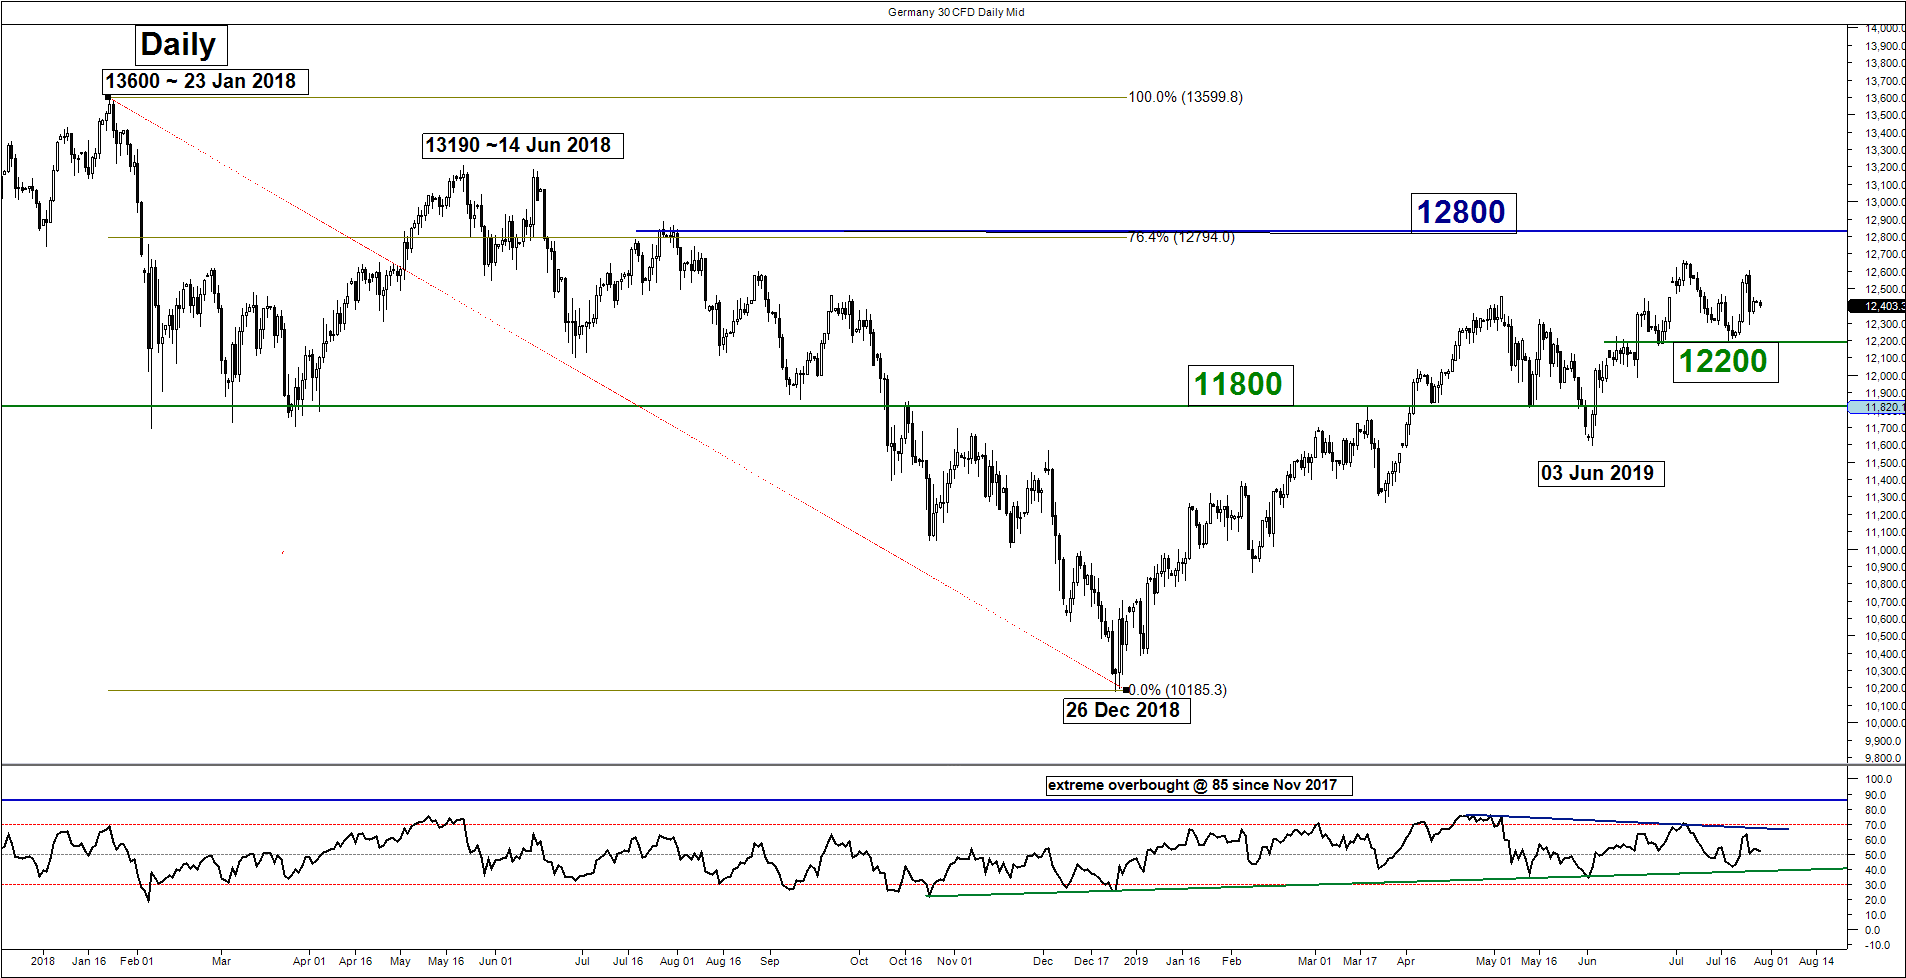
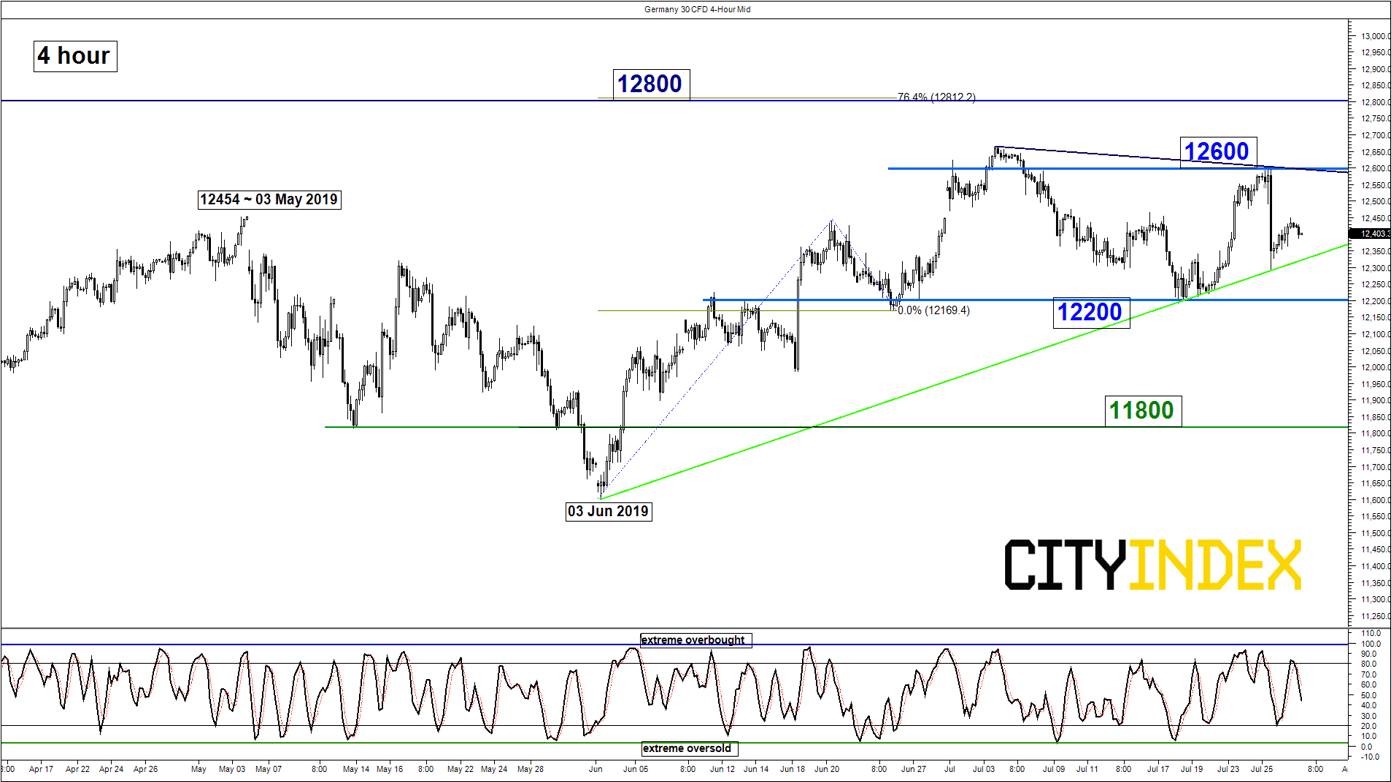
Resistances: 12600 & 12800
Supports: 12200 & 11800
Medium-term (1 to 3 weeks) Outlook
Last week, the Germany 30 Index (proxy for the DAX futures) has managed to stage a push up and stalled a descending trendline in place since 04 Jul 2019 high.
Mix elements at this juncture, thus prefer to turn neutral between 12600 (the descending trendline resistance) and 12200. Only a break below 12200 opens up scope for a corrective decline towards the 11800 major support.
On the flipside, a clearance above 12600 sees a squeeze up towards the next resistance at 12800 (also the 76.4% Fibonacci retracement of the previous major degree down move from 23 Jan 2018 high to 26 Dec 2018 low).
Charts are from City Index Advantage TraderPro & eSignal
Latest market news
Yesterday 10:40 PM
Yesterday 04:00 PM
Latest Australia 200 articles
February 15, 2024 11:33 PM
February 15, 2024 01:42 AM
February 14, 2024 05:39 AM