


S&P 500 – Potential residual push up to target 3045 key resistance
click to enlarge charts
Key Levels (1 to 3 weeks)
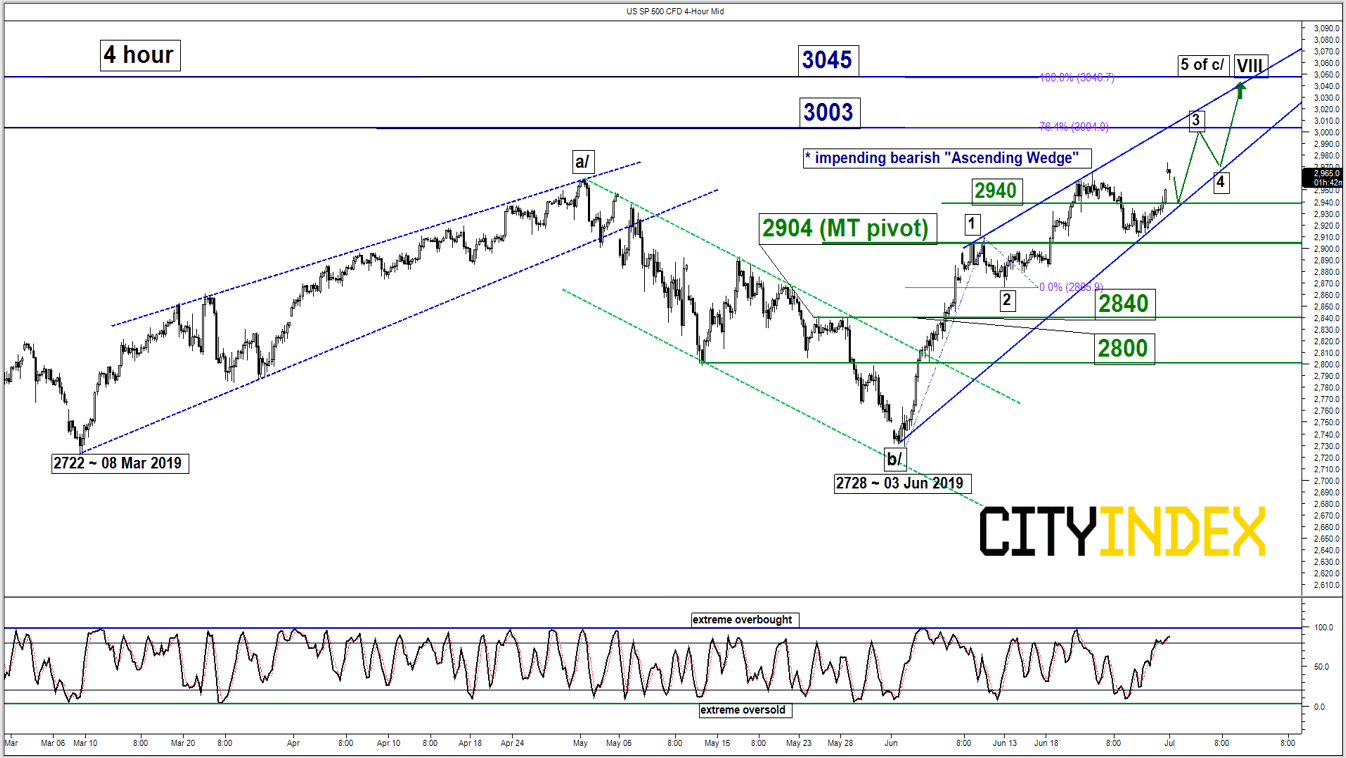
Intermediate support: 2940
Pivot (key support): 2904
Resistances: 3003 & 3045 (Fibonacci expansions)
Next supports: 2840 & 2800
Medium-term (1 to 3 weeks) Outlook
Last week’s drop of 1.5% seen in the SP 500 Index (proxy for the S&P 500 futures) from its all-time high of 2964 printed on 21 Jun has managed to stage the expected upside reversal right above the 2900 pivotal support as per highlighted in our previous report (click here for recap).
In today’s Asian session (01 Jul), the Index has gapped up to print another fresh all-time high of 2973 reinforced by the agreed trade war truce between U.S. and China post G20 summit and U.S. President Trump’s “180 degree policy U-turn” on China’s technology firm, Huawei by allowing U.S. corporations to resume business dealings with Huawei on certain products after it was blacklisted earlier due to U.S. national security concerns.
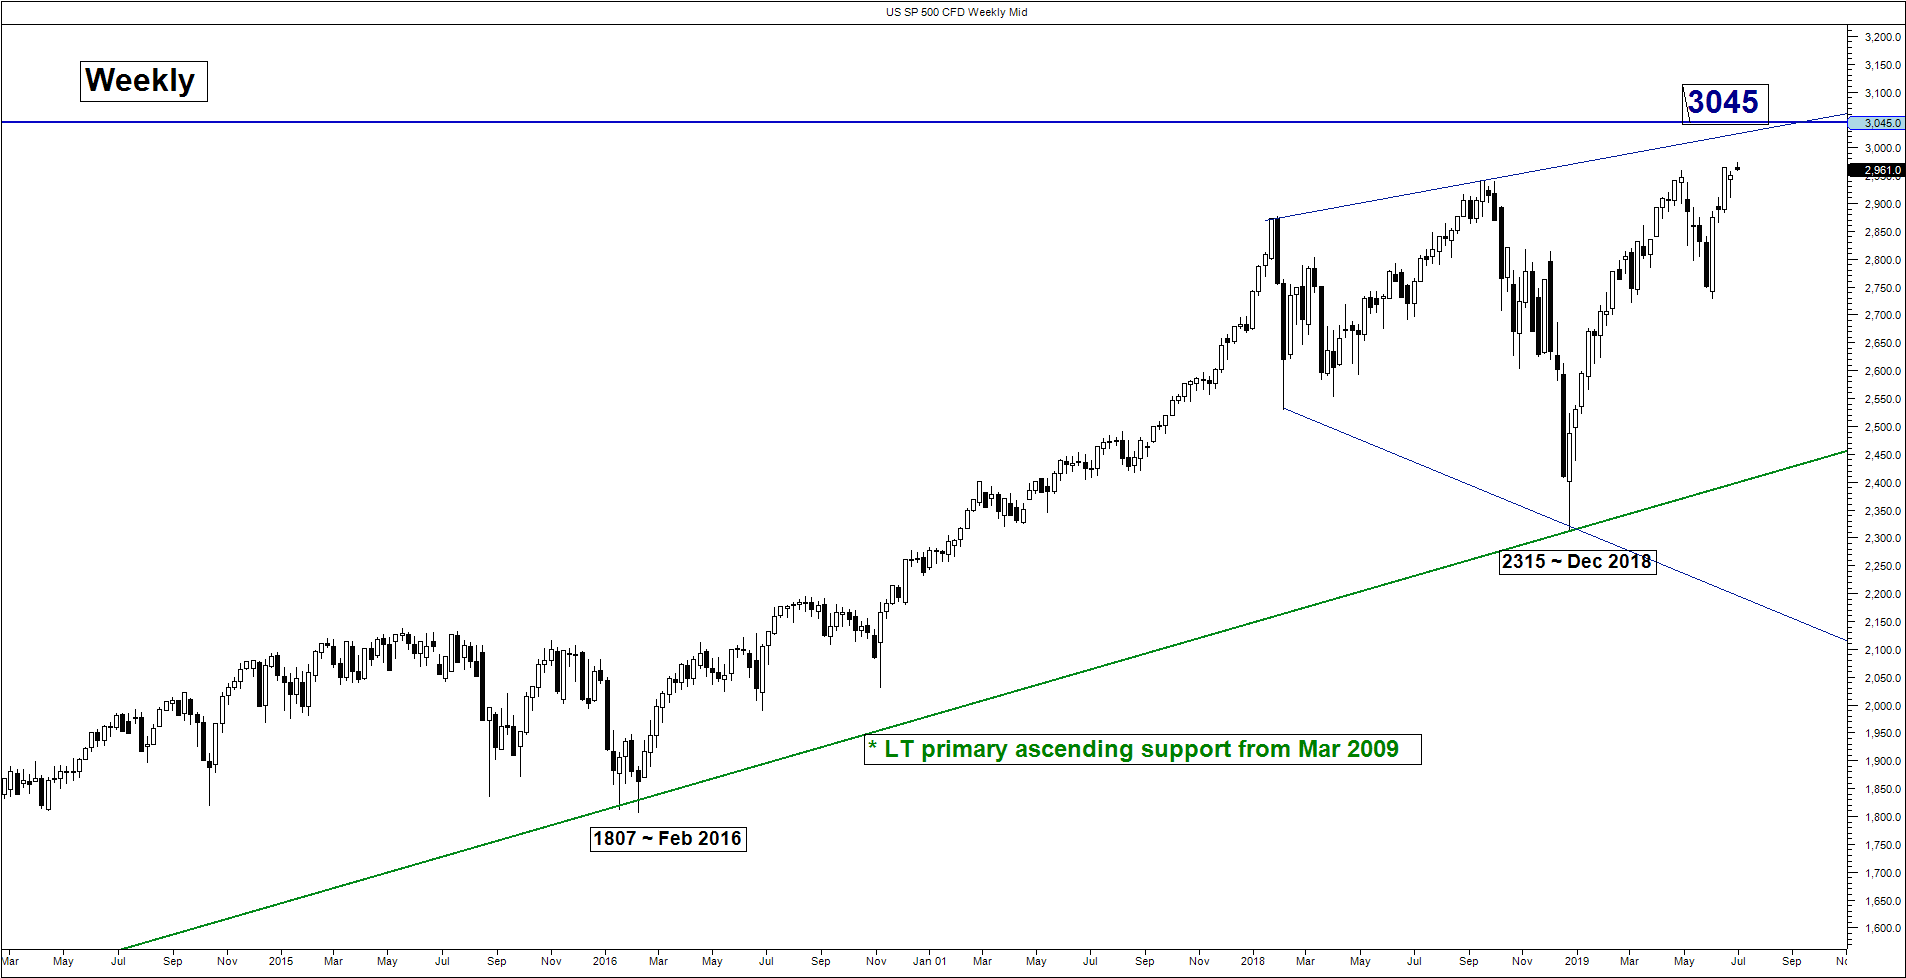
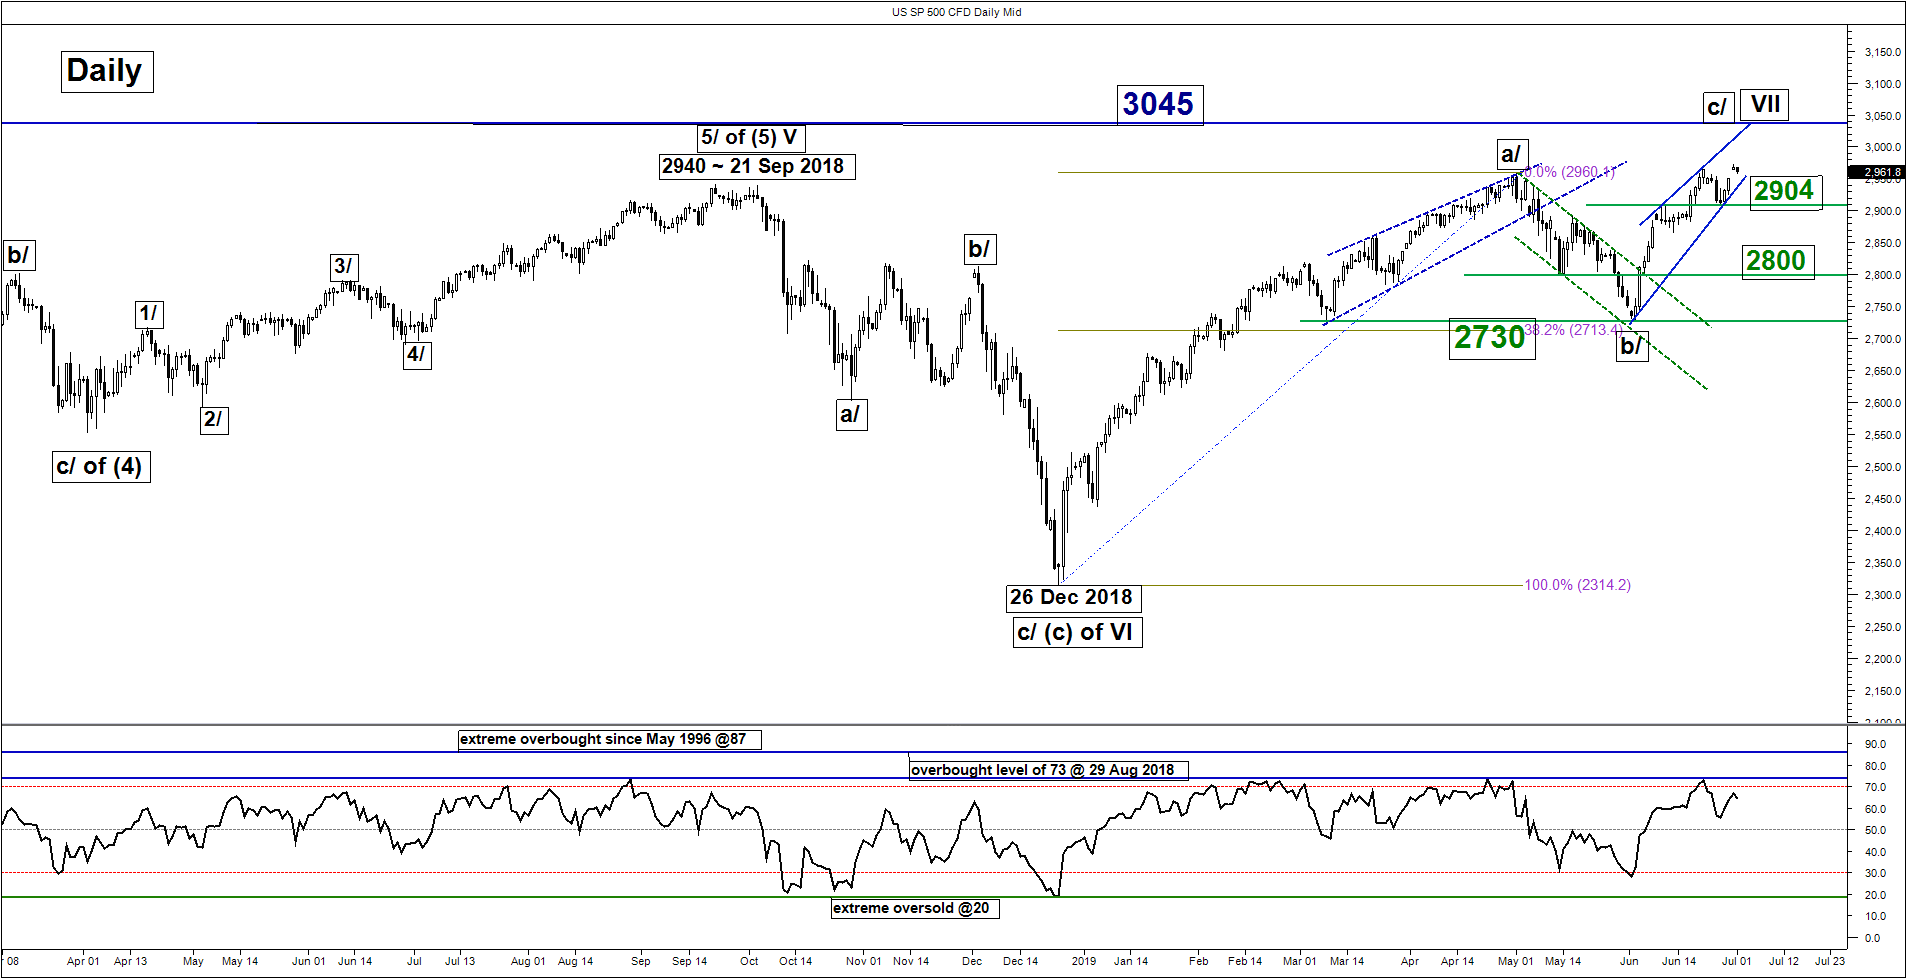
Key technical elements remain positive in the medium-term (1 to 3 weeks) for the Index and its latest price action has reinforced our technical view that the up move sequence in place since its Dec 2018 low of 2315 is in the potential tail-end stages of the melt-up phase within a primary topping configuration.
- Since its low of 2728 printed on 03 Jun 2019, it is now undergoing an impending bearish “Ascending Wedge” configuration within a longer-term “Expanding Wedge” in place since 21 Sep 2018.
- The upper boundary of the medium-term “Ascending Wedge” now stands at 3045 which also confluences with the 1.00 Fibonacci expansion of the up move from 03 Jun low to 11 Jun high projected from 13 Jun 2019 low.
No change, maintain bullish bias with an adjusted key medium-term pivotal support now at 2904 for a further potential push up to target the next resistances at 3003 and 3045 before the risk of a multi-week correction materialises.
On the other hand, a break with a daily close below 2905 invalidates the bullish scenario to kick start the multi-week corrective decline sequence towards the next support at 2840 and even 2800 next.
Nikkei 225 – Further push up remains in progress within corrective rebound sequence
click to enlarge charts
Key Levels (1 to 3 weeks)
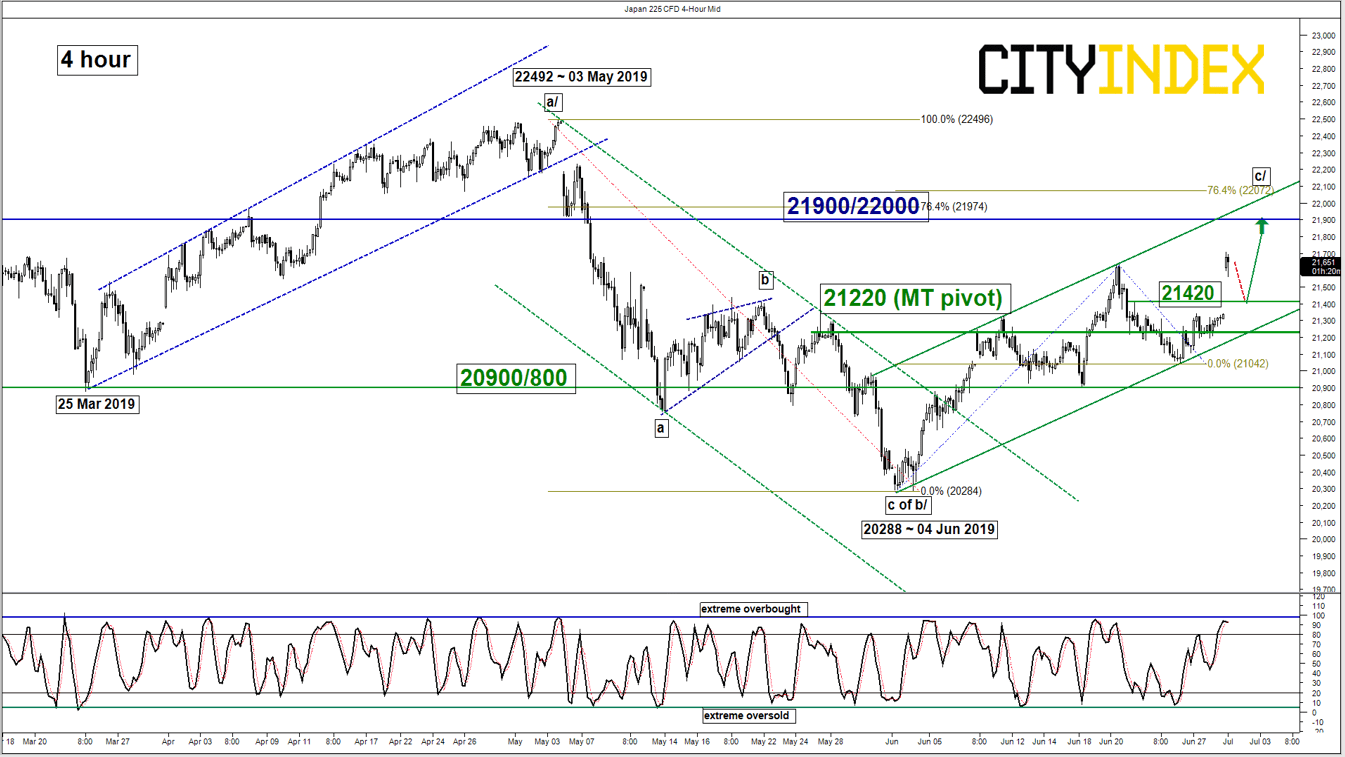
Intermediate support: 21420
Pivot (key support): 21220
Resistance: 21900/22000
Next support: 20900/800
Medium-term (1 to 3 weeks) Outlook
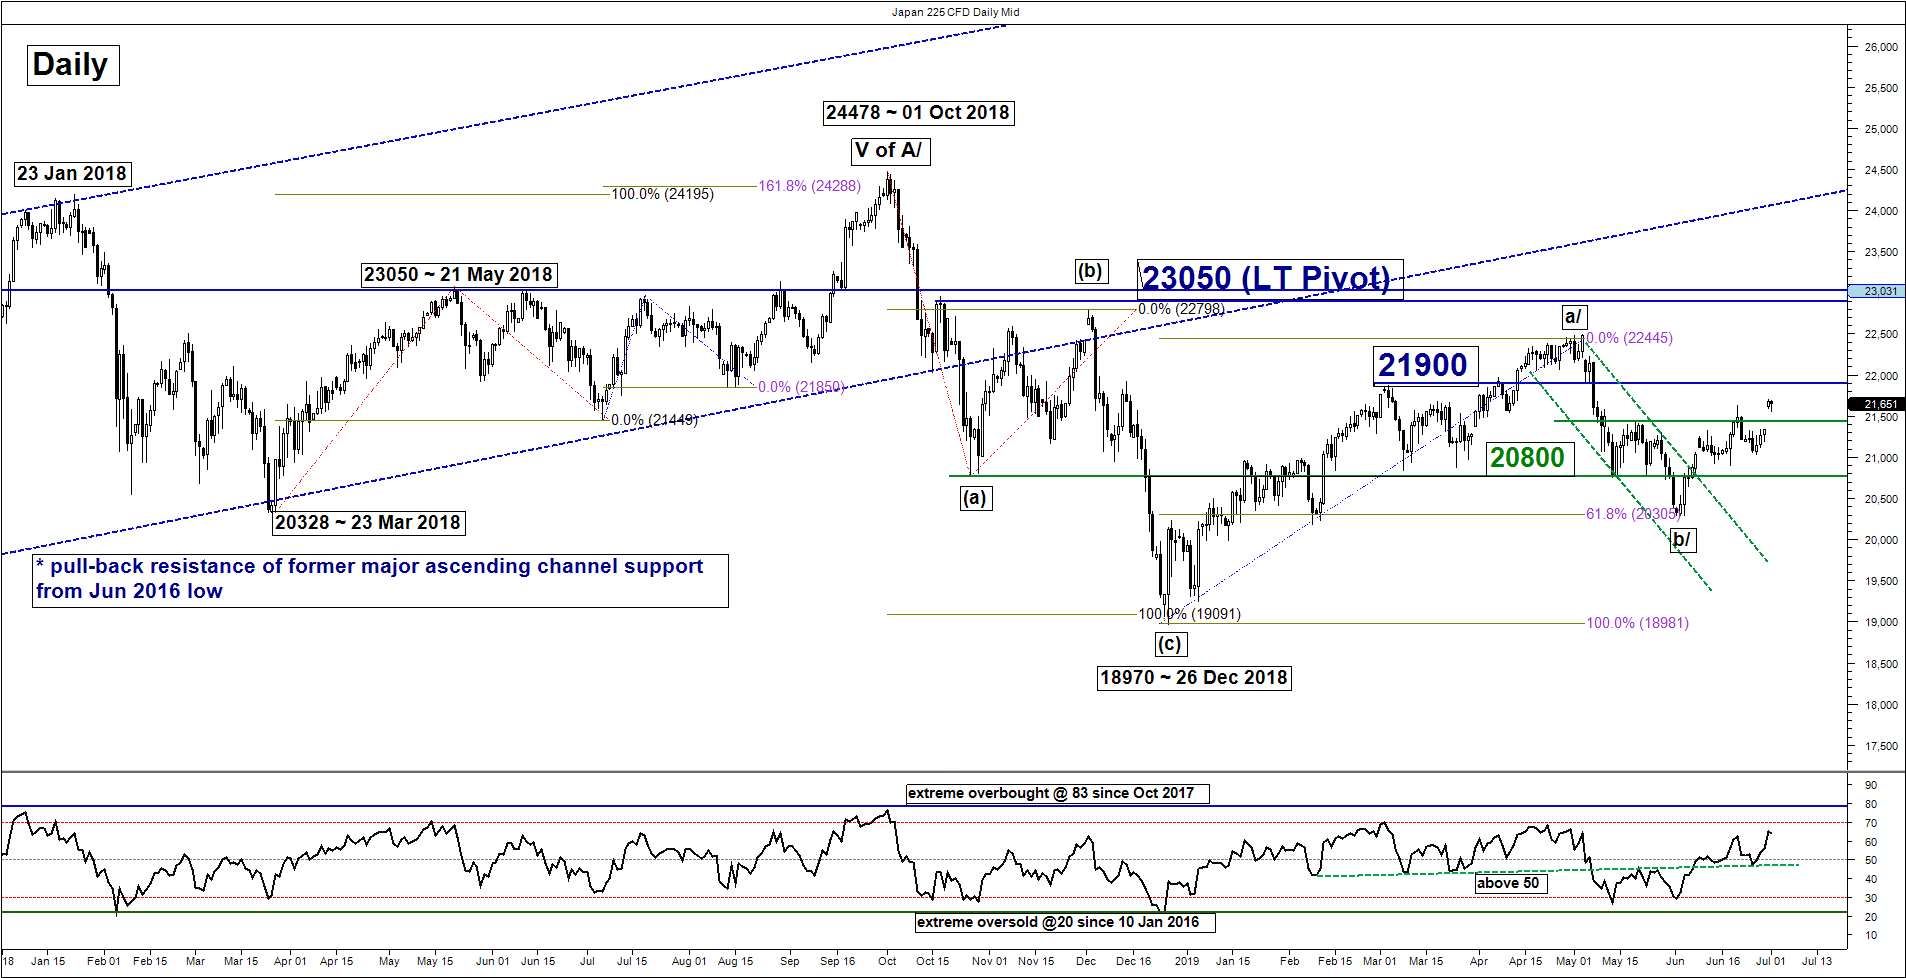
The Japan 225 Index (proxy for the Nikkei 225 futures) has gapped as well in today’s Asian session (01 Jul). It printed a current intraday high of 21706 and surpassed the first medium-term upside target/resistance of 21600 as per highlighted in our previous report.
The Index now faces the risk of a minor pull-back towards the 21420 intermediate support to cover today’s Asian session gapped up with an extreme overbought level reached on the 4-hour Stochastic oscillator. Thus, we maintain the bullish bias in any dips above a tightened key medium-term pivotal support now at 21220 (also the lower boundary of the ascending channel from 04 Jun 2019 low) for a further potential push up to target the next resistance at 21900/22000 (also a Fibonacci retracement/expansion cluster).
On the other hand, a break with a daily close below 21220 negates the bullish tone for a deeper slide towards the next support at 20900/800.
Hang Seng – Further push up in progress

click to enlarge charts
Key Levels (1 to 3 weeks)
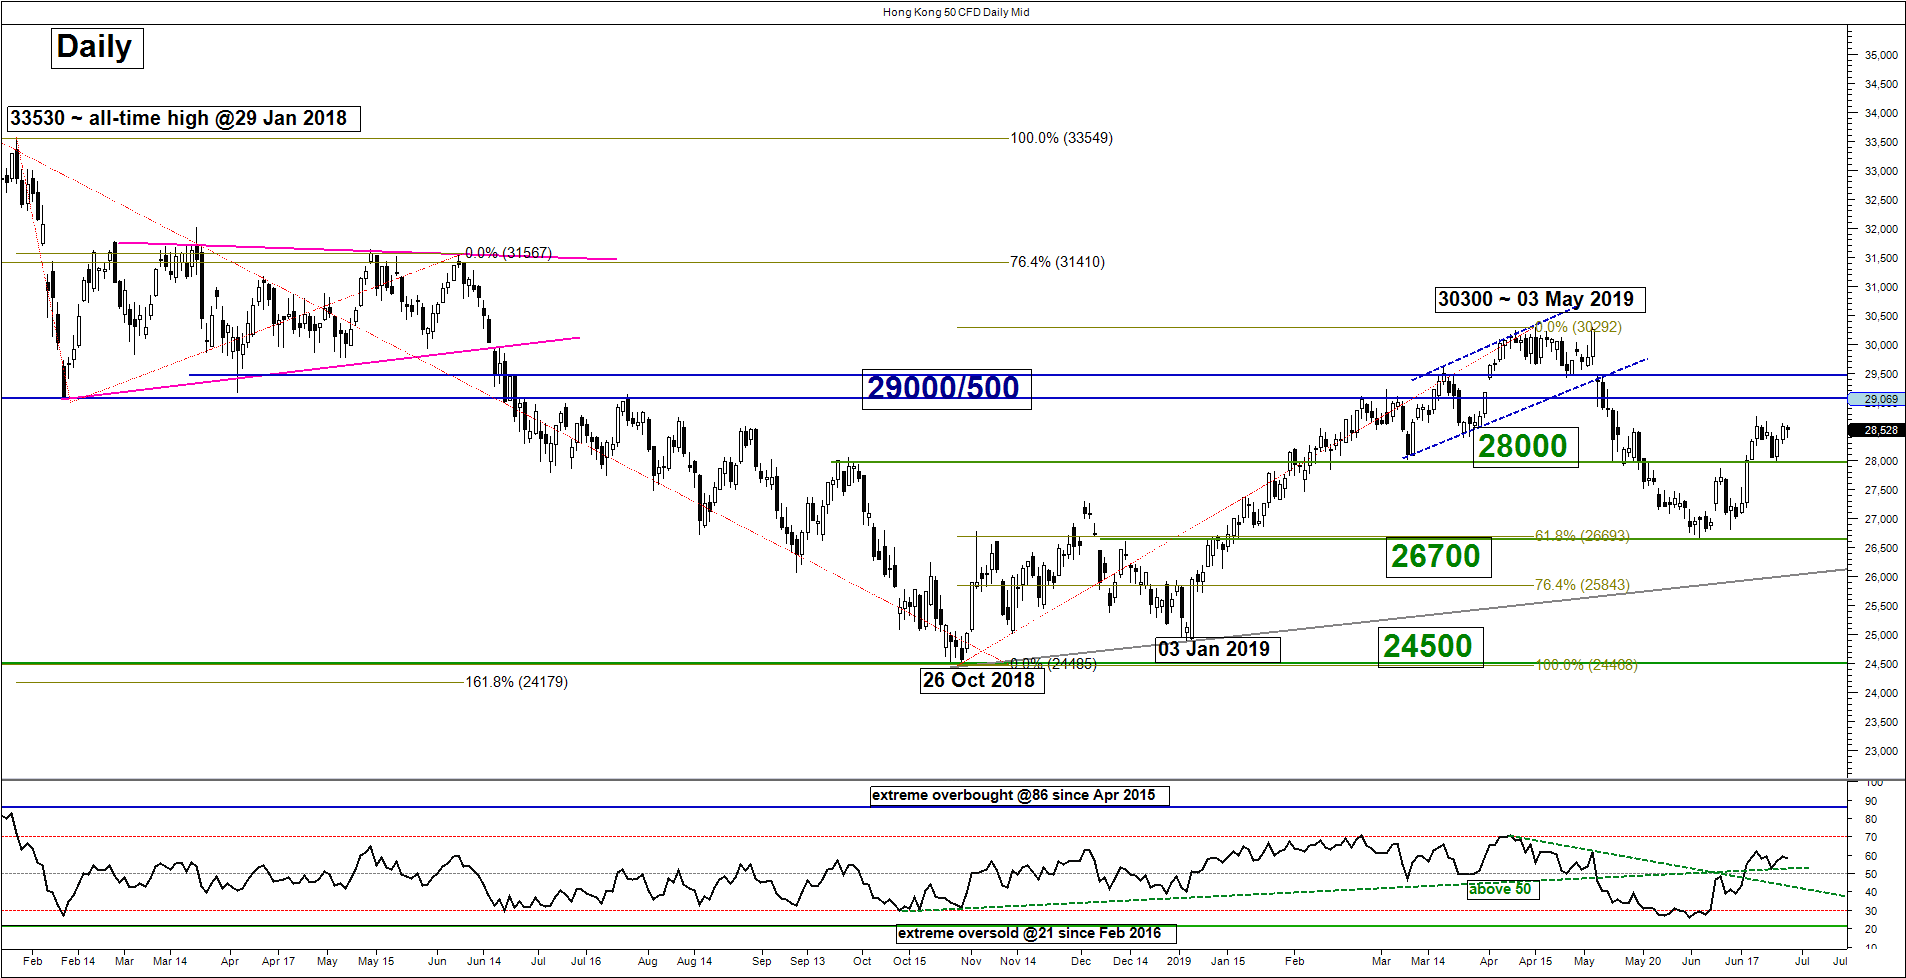
Intermediate support: 28300
Pivot (key support): 28000
Resistances: 29000 & 29500
Next support: 26700
Medium-term (1 to 3 weeks) Outlook
The Hong Kong 50 Index (proxy for Hang Seng Index futures) has continued to inch higher as expected after a test on the key 28000 medium-pivotal support seen last Wed, 26 Jun.
Maintain the bullish bias for a further potential push up to target 29000 and 29500. On the other hand, a break with a daily close below 28000 invalidates the bullish scenario for slide back towards the recent swing low of 26700 printed on 04/13 Jun 2019.
ASX 200 – Bullish configuration remains intact
click to enlarge charts
Key Levels (1 to 3 weeks)
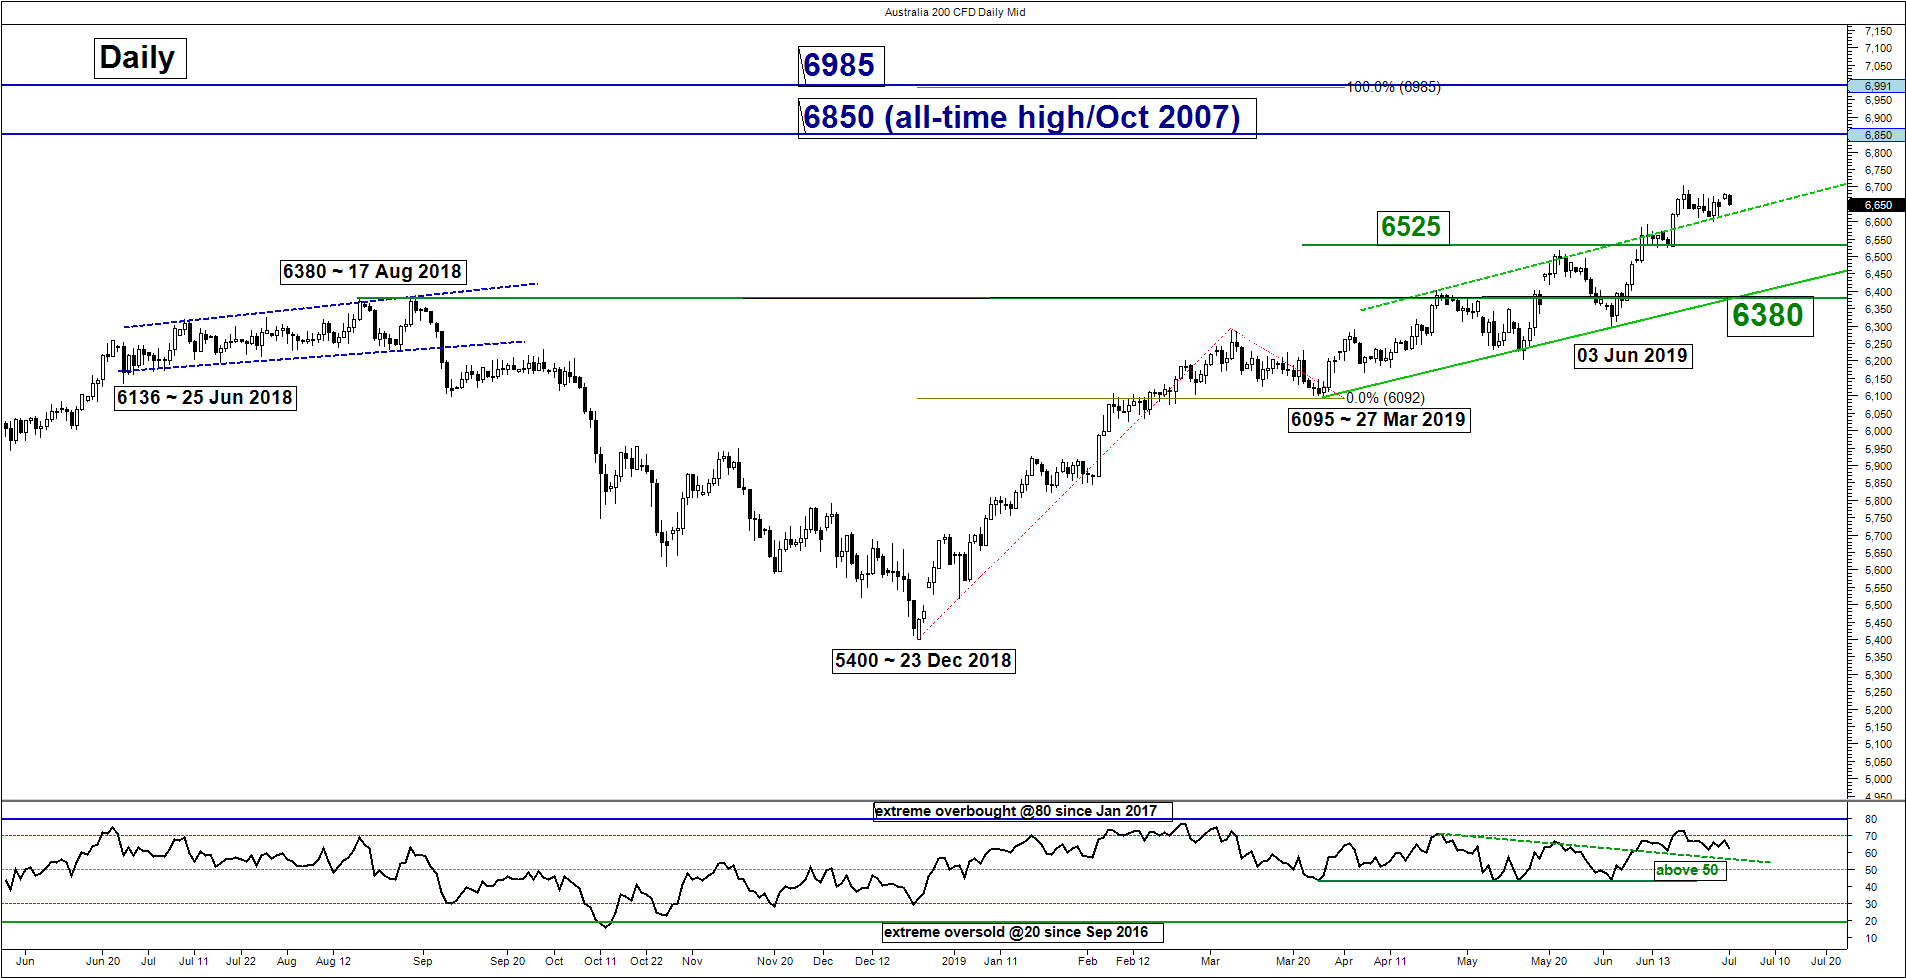
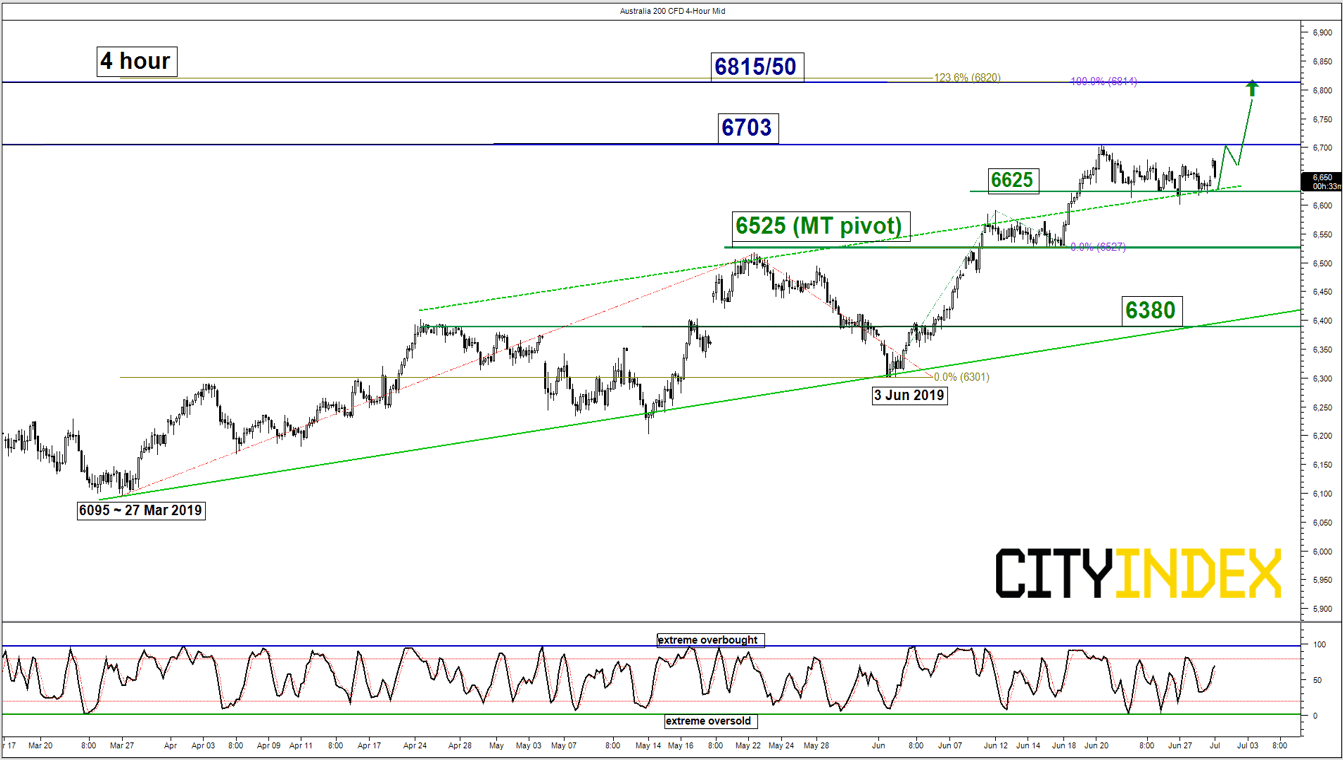
Intermediate support: 6625
Pivot (key support): 6525
Resistances: 6703 & 6815/6850
Next support: 6380
Medium-term (1 to 3 weeks) Outlook
No major changes on its key technical elements for the Australia 200 Index (proxy for the ASX 200 futures). We maintain the bullish bias with 6525 remains as the key medium-term pivotal support for a potential push up to retest the recent 20 Jun 2019 high of 6703 before targeting the next resistance zone at 6815/50 (all-time high & Fibonacci expansion cluster).
On the other hand, a break with a daily close below 6525 invalidates the bullish scenario to kickstart a minor corrective decline sequence towards the next support at 6380.
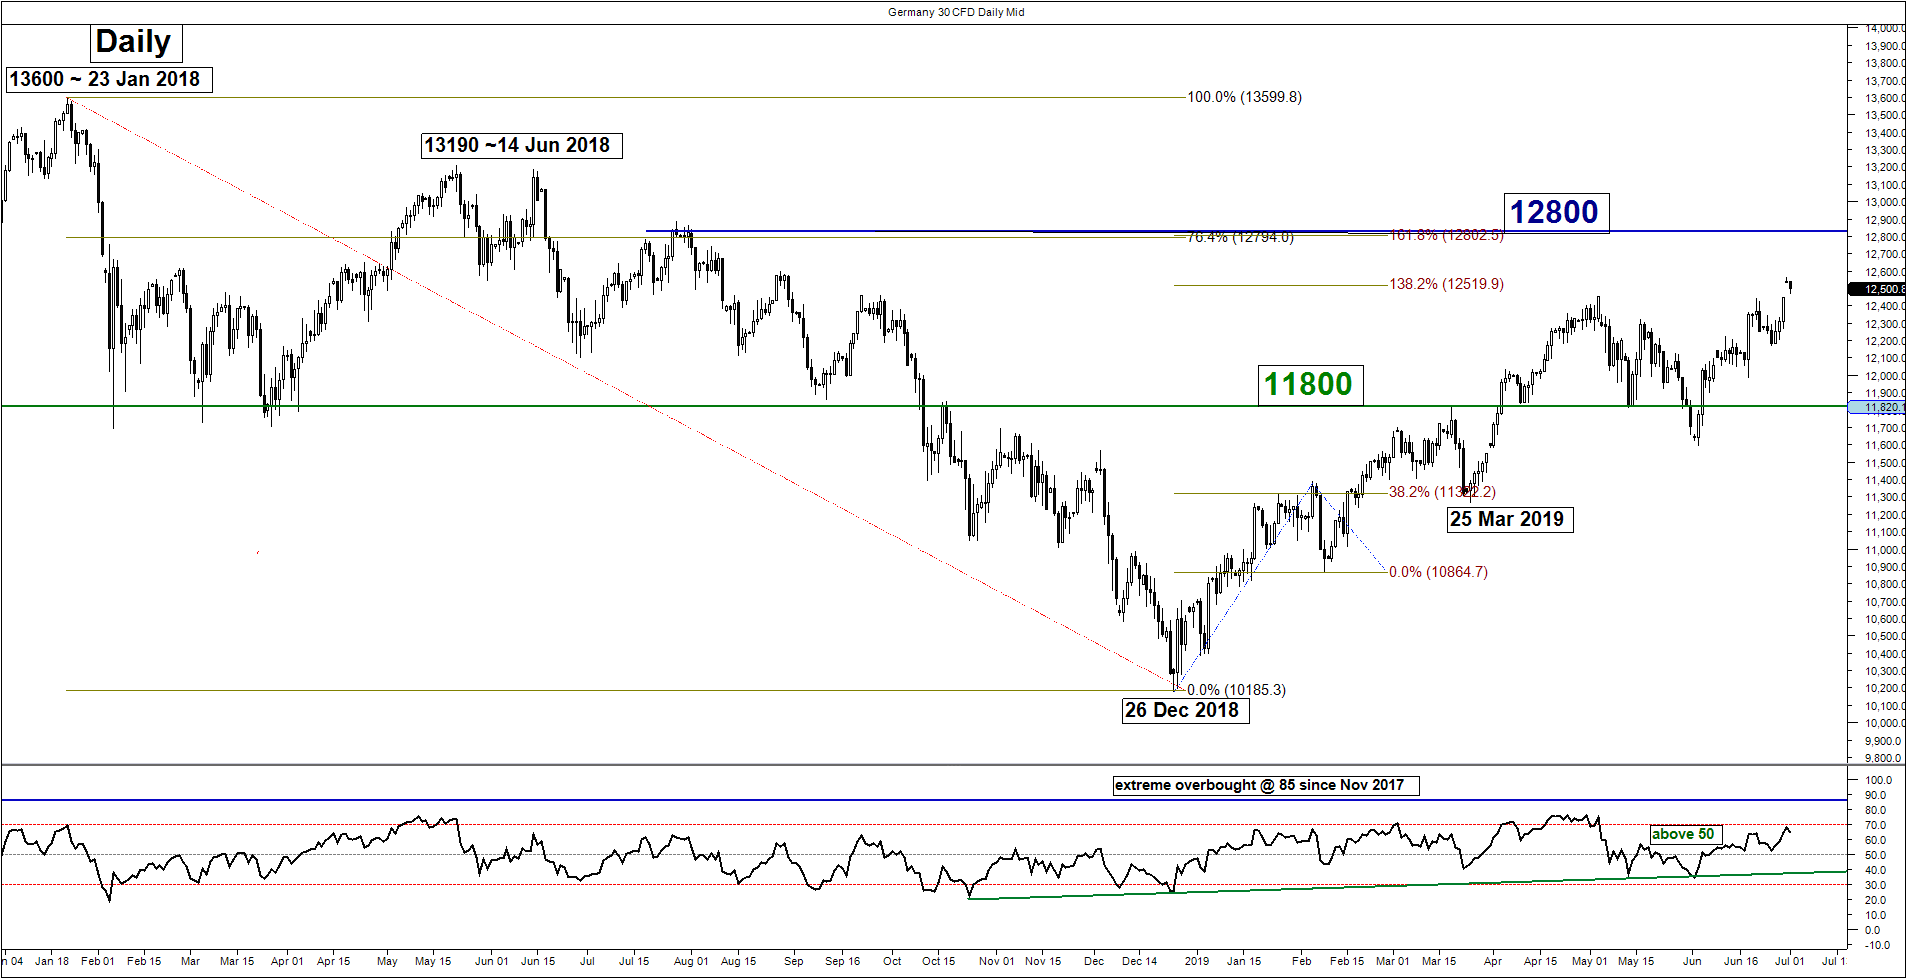
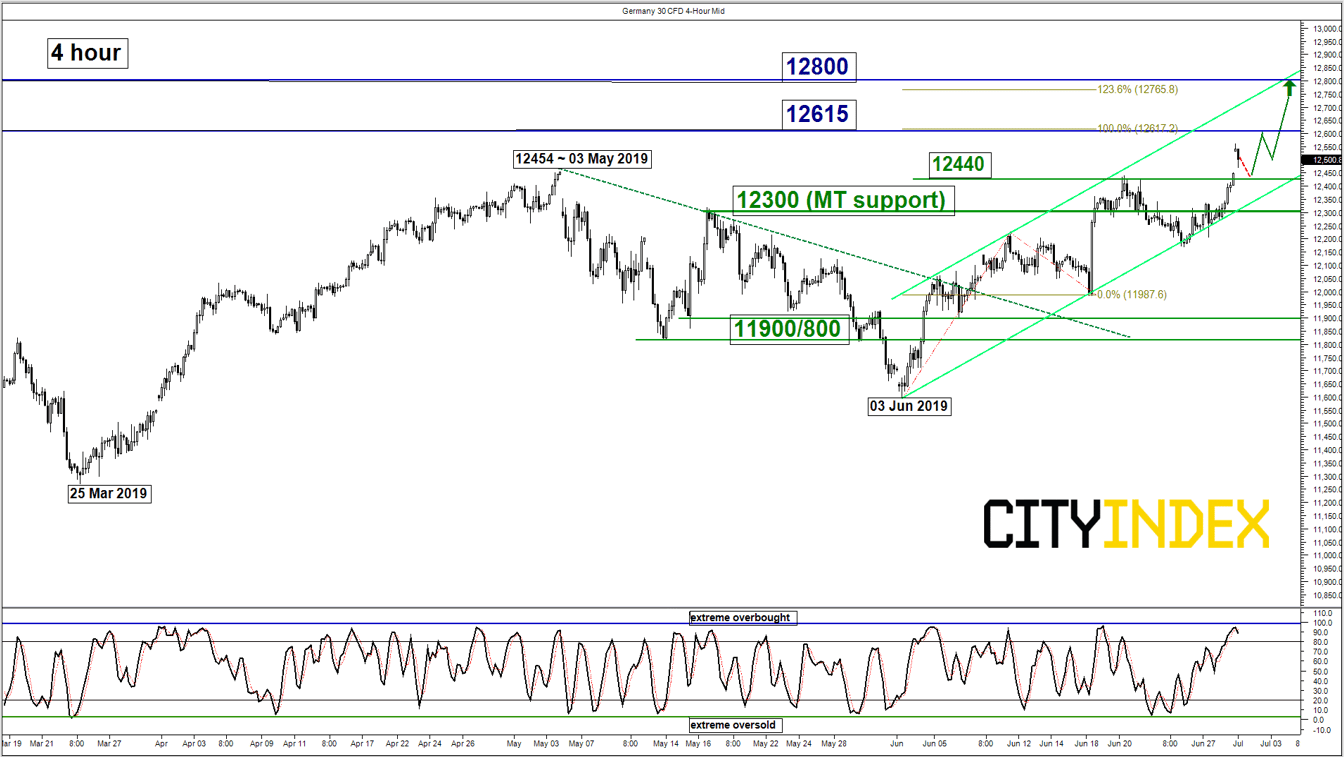
DAX – Minor pull-back before new upleg above 12300 key support
click to enlarge charts
Key Levels (1 to 3 weeks)
Intermediate support: 12440
Pivot (key support): 12300
Resistances: 12615 & 12800 (Fibonacci expansion/retracement cluster)
Next support: 11900/800
Medium-term (1 to 3 weeks) Outlook
Last week, the Germany 30 Index (proxy for the DAX futures) had staged the expected upside reversal after a test on the 12180 key medium-term pivotal support.
In today’s Asian session (01 Jul), it has gapped up to print a current intraday high of 12561 on trade deal optimism between U.S and China post G20. Overall, medium-term technical elements remain positive but in the shorter-term, due to an extreme overbought reading seen in the 4-hour Stochastic oscillator, the Index may see a potential minor pull-back at this juncture towards the 12440 intermediate support before another round of upleg sequence materialises.
Thus, we maintain the bullish bias in any dips above a tightened key medium-term pivotal support now at 12300 (also the lower boundary of the ascending channel from 03 Jun 2019 low) for a further potential push up to target the next resistances at 12615 and 12800.
On the other hand, a break with a daily close below 12300 invalidates the bullish scenario for a deeper slide to retest the major support zone of 11900/800.
Charts are from City Index Advantage TraderPro
Latest market news
Yesterday 11:09 PM
Yesterday 11:01 PM
Yesterday 04:00 PM
Yesterday 01:15 PM
Yesterday 11:30 AM
Yesterday 08:18 AM
Latest Indices articles
April 18, 2024 04:46 PM
April 17, 2024 11:00 AM
April 16, 2024 08:00 PM
April 16, 2024 04:54 PM