


US traders are back at their desks after the long Labor Day weekend marked the unofficial end of summer, and they’ve come back to a busy week indeed. As my colleague Joe Perry noted in his Week Ahead report, there are a number of highly-anticipated central bank meetings this week, including the RBA (which hiked by 50bps overnight as expected), BOC, and ECB.
However, it’s not the currencies impacted by these central bank meetings that are the biggest movers so far this week; instead traders are focused on what has been the biggest FX trend of 2022 so far, the relentless strength in USD/JPY.
From a fundamental perspective, the stark central bank policy divergence between the Fed and BOJ is an easy story for traders to grasp onto: The BOJ is stridently committed to easy policy through its yield curve control (YCC) program while the Fed continues to raise interest rates aggressively in an attempt to rein in inflation. Unless or until the BOJ starts to worry about inflation or the Fed sees the US economy slowing enough to pause its rate hikes, that fundamental dynamic should continue to push USD/JPY higher.
With the 2-year Treasury yield on track to close above 3.50% today, its highest level in 15 years, there’s little sign of the fundamental momentum flagging yet.
Technical view: USD/JPY
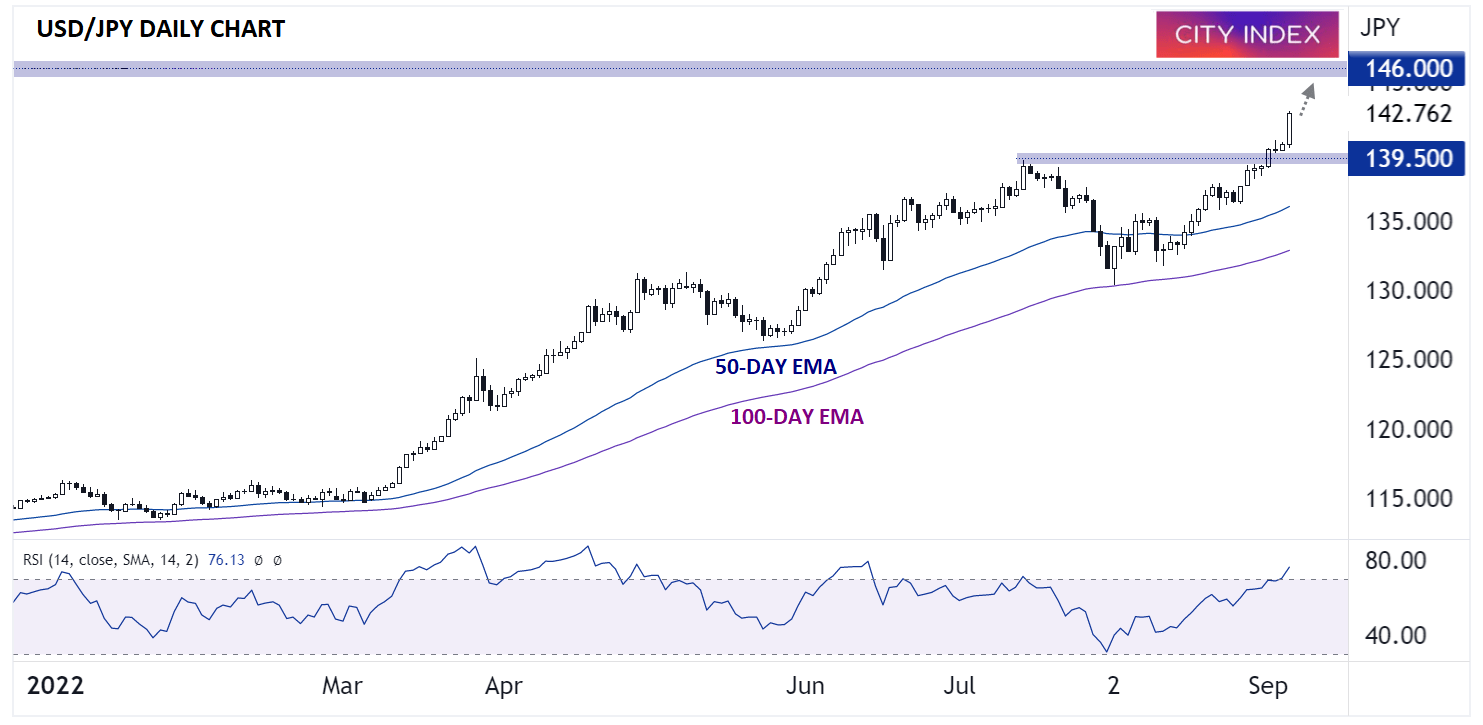
Looking at the chart, USD/JPY is seeing a clean breakout above the summer highs just below 140.00 after pulling back to consolidating around its 50-day EMA through the first half of August. Now, there’s little in the way of previous resistance levels until the 1998 highs starting in the 146.00 area:
Source: TradingView, StoneX
While it is notable that the 14-day RSI indicator is technically in “overbought” territory above 70, it has remained in a bullish range (>30) this entire year and could easily rise further before flashing a true warning sign for bulls. At this point, only a move back below previous-resistance-turned-support in the 139.50 area would erase the near-term bullish technical bias.
How to trade with City Index
You can trade with City Index by following these four easy steps:
-
Open an account, or log in if you’re already a customer
• Open an account in the UK
• Open an account in Australia
• Open an account in Singapore
- Search for the market you want to trade in our award-winning platform
- Choose your position and size, and your stop and limit levels
- Place the trade
Latest market news
Yesterday 03:30 PM
Yesterday 01:23 PM
Yesterday 11:00 AM
Yesterday 08:15 AM
Latest USD articles
April 23, 2024 11:09 PM
April 23, 2024 11:01 PM
April 23, 2024 01:15 PM
April 23, 2024 04:19 AM