USD/CAD: Is a bottom near?
“Those who pick bottoms get stinky fingers”
“Only baboons pick bottoms”
These memorable, if rather lewd, trading aphorisms serve as a reminder of the risks when betting against established downtrends. While trading against a trend tends to be a lower-probability strategy, it can offer strong risk/reward ratios if the stars align, and the current setup in USD/CAD may present an opportunity to do just that.
Fundamentally speaking, the ongoing strength in the Canadian dollar is relatively easy to explain. The price of oil, Canada’s most important export, has consistently moved higher over the last year, and WTI on the verge of breaking out to a nearly 3-year high above $67 as of writing. Meanwhile, short-term Canadian yields have actually risen more than their US counterparts over the last year, signaling investor confidence in the economic recovery and the potential for the Bank of Canada to raise interest rates earlier than most of the developed world.
Looking at the chart, USD/CAD has been grinding relentlessly lower for more than a year since peaking above 1.46 amidst last March’s COVID-driven “flight to safety” surge in the US dollar. The pair has fallen about 2,500 pips over that period, with the 50-day EMA reliably capping short-term rallies since last October.
Notably, rates fell more than 350 pips below their 50-day EMA earlier this month and are still trading more than 200 pips below that medium-term trend measure as we go to press. Over the last year, USD/CAD has consistently formed at least a near-term bottom any time it fell more than 300 pips below its 50-day EMA.
In addition, as my colleague Matt Simpson noted earlier this week, speculators are more bullish on the loonie (bearish on USD/CAD) than they’ve been at any point in the last 18 months according to the CFTC’s Commitment of Traders report; positioning extremes like this are often seen as contrarian indicators that may be prone to reverse. With the more widely-followed 14-day RSI indicator forming a triple bullish divergence and rates testing strong previous support at the six-year lows near 1.2060, there are numerous indicators of at least a short-term bottom in USD/CAD:
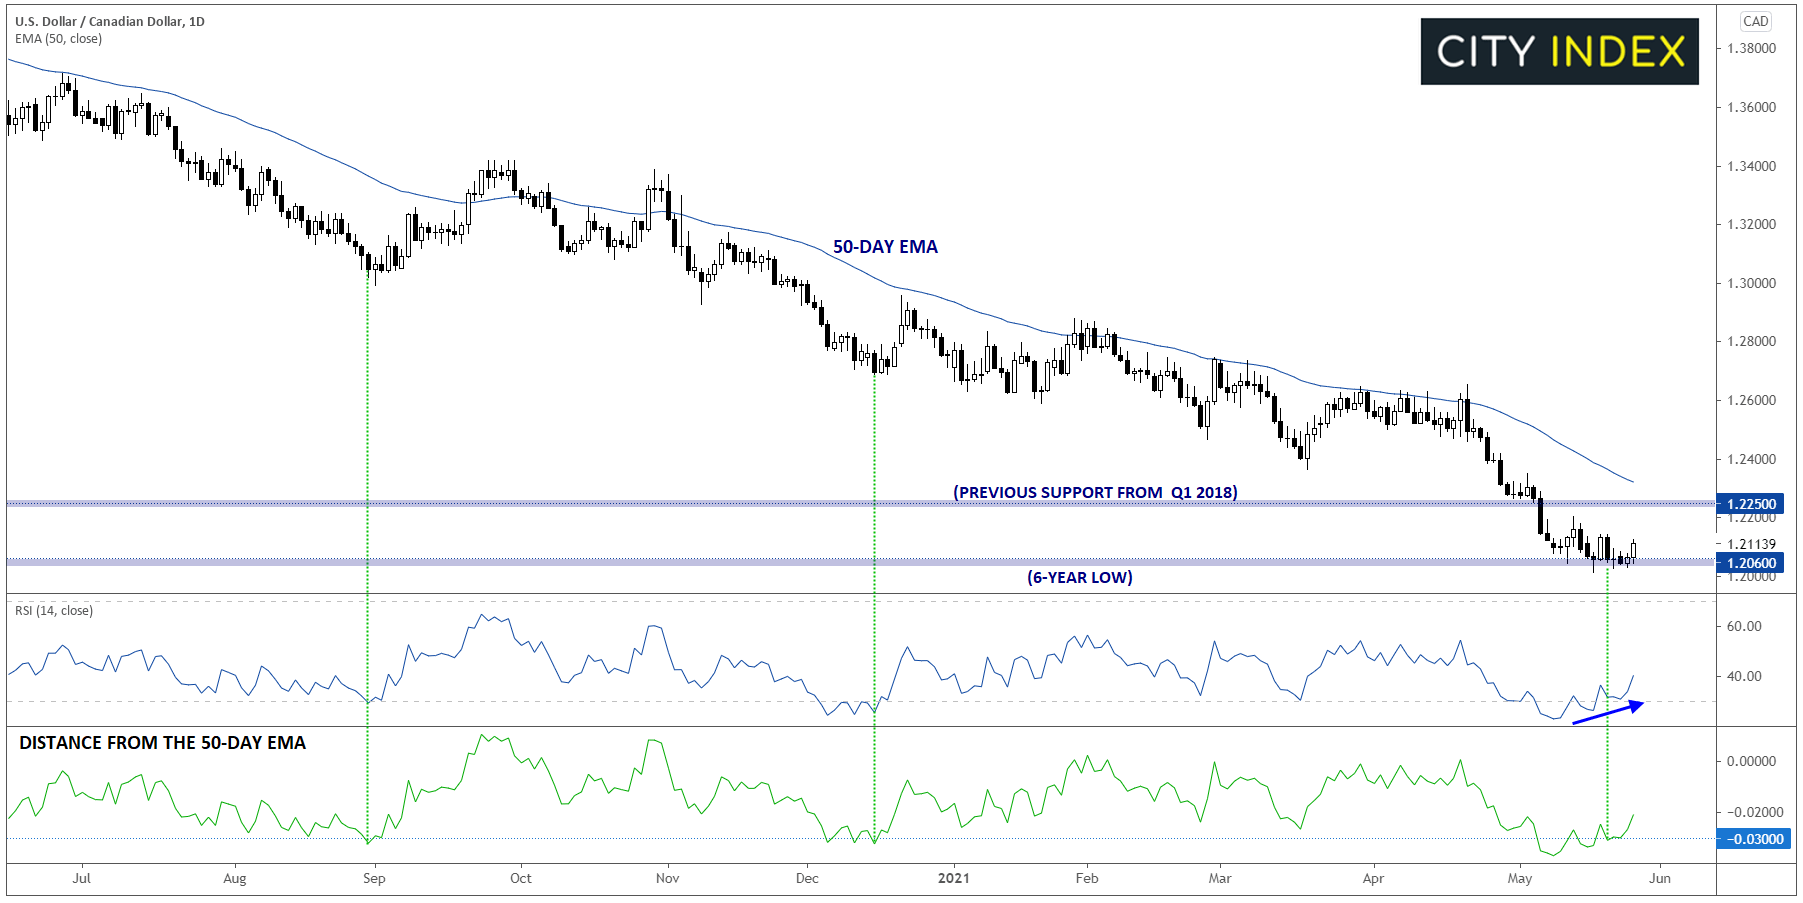
Source: TradingView, StoneX
If the current low holds, the most immediate near-term target for bottom pickers will be previous-support-turned-resistance at 1.2250, followed by the 50-day EMA near 1.2320. Of course, to avoid getting a stinky finger, readers should consider setting stops on any counter-trend trade, with a break to new six-year lows below the 1.20 handle in this case opening the door for an accelerated selloff from here.
Learn more about forex trading opportunities.
How to trade with City Index
Follow these easy steps to start trading with City Index today:
- Open a City Index account, or log-in if you’re already a customer.
- Search for the market you want to trade in our award-winning platform.
- Choose your position and size, and your stop and limit levels.
- Place the trade.
Latest market news
Today 04:00 PM
Today 01:15 PM
Today 11:30 AM
Today 08:18 AM
Latest Forex articles

Today 04:00 PM