USD CHF coiling for a big breakout
The daily chart of the USD/CHF (figure 1) continues to show constructive technical signals as far as the bullish case is concerned. Obviously the biggest […]
The daily chart of the USD/CHF (figure 1) continues to show constructive technical signals as far as the bullish case is concerned. Obviously the biggest […]
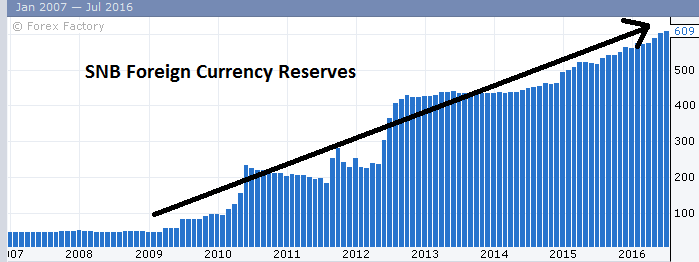
The daily chart of the USD/CHF (figure 1) continues to show constructive technical signals as far as the bullish case is concerned. Obviously the biggest risk to any technical outlook is sudden changes in sentiment because of some fundamental stimuli, such as the ongoing Brexit risks and Friday’s US jobs report among others. But with the SNB actively intervening in the FX markets (as indicated by the ballooning foreign currency reserves, which rose a further 7 billion francs in June to 609 billion – see the chart in figure 2) and the Fed still being the only major central bank looking to raise rather than cut interest rates (at some point), the fundamental outlook for the Swissy continues to remain bullish. It looks like all the USD/CHF needs now is just a push to trigger potential momentum buying interest and this trigger could come in the form of a solid NFP report on Friday.
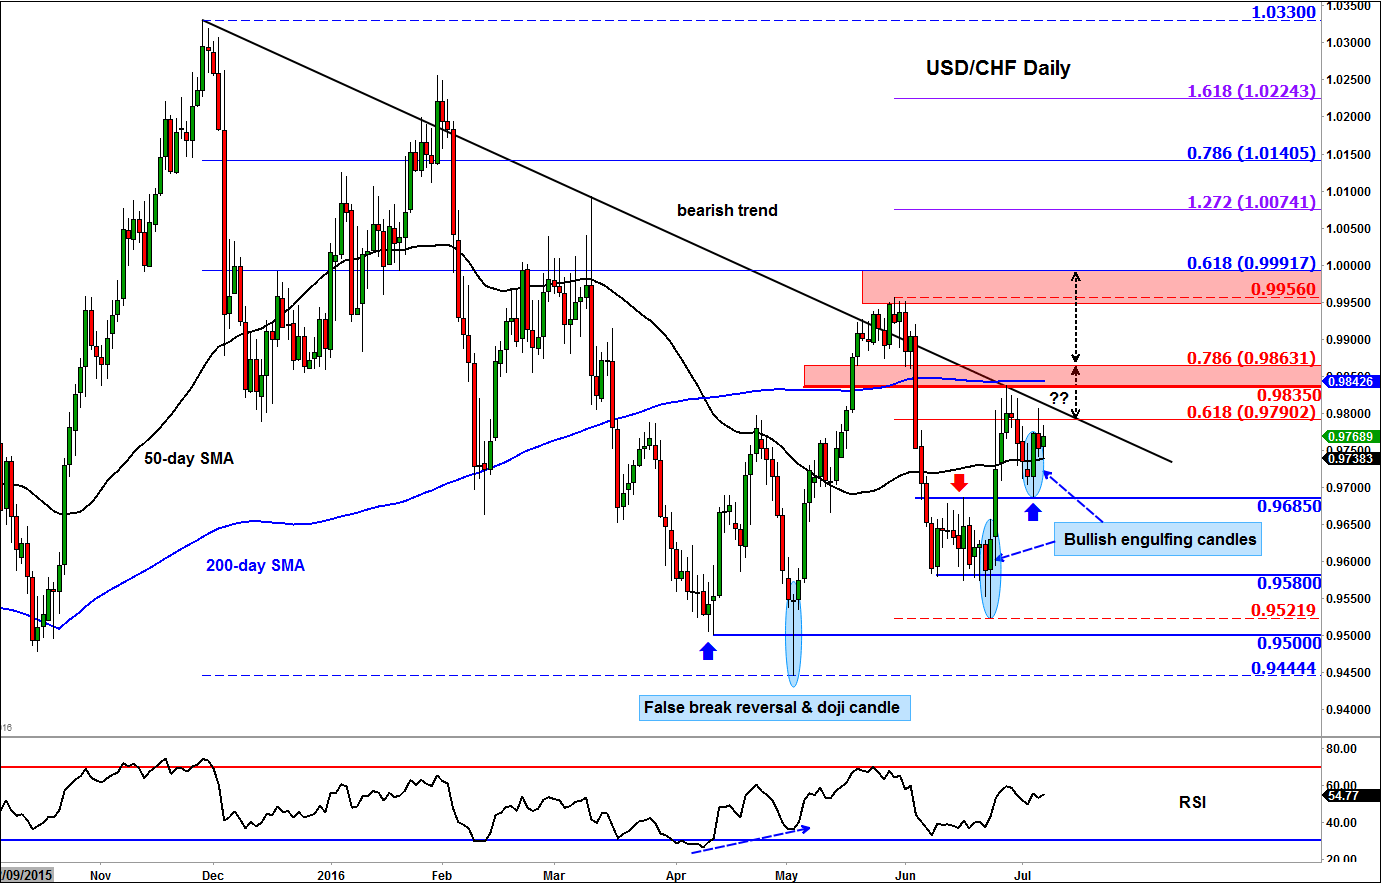
As can be seen, the key reversal day was actually back in May 3 when price broke below the prior low at 0.9500, but finished the day significantly above this psychologically-important level, around where it had opened. As a result, a false break reversal pattern was formed with price also showing a doji candlestick formation, which is typically found near trend extremes. A sharp rally then followed as the sellers abandoned their positions and new buyers stepped in. This rebound eventually came to an end near the bearish trend line and the break above the 200-day moving average proved to be a temporary one. But then another rally initiated following a lengthy pause in the 0.9580-0.9685 range. Once again, there was a false break down scenario where the bears’ attempts to push price below this range was rejected, resulting in a bullish engulfing candle and a subsequent bounce. This rally also came to a halt around the bearish trend line but the corresponding dip was bought this Tuesday at the top of the former range i.e. 0.9685 where price formed another bullish engulfing candle.
So within the larger consolidation pattern, there are bullish signs emerging that suggest a bullish breakout could be on the cards soon. Conservative trend traders may wish to wait for this potential scenario to unfold before jumping on the bandwagon, while for the shorter-term-focused speculators there should be plenty of opportunities to take advantage of even before that potential bullish breakout occurs. Some of the potential levels of support and resistance are shown on the chart in blue and red, respectively. It will be a bearish outcome should the Swissy move back below 0.9685 support.