


Yesterday’s US CPI report tossed a Molotov cocktail into an already explosive market for treasury bonds, with an alarming impact on the US yield curve:
Short-term yields rise on more aggressive rate hike expectations…
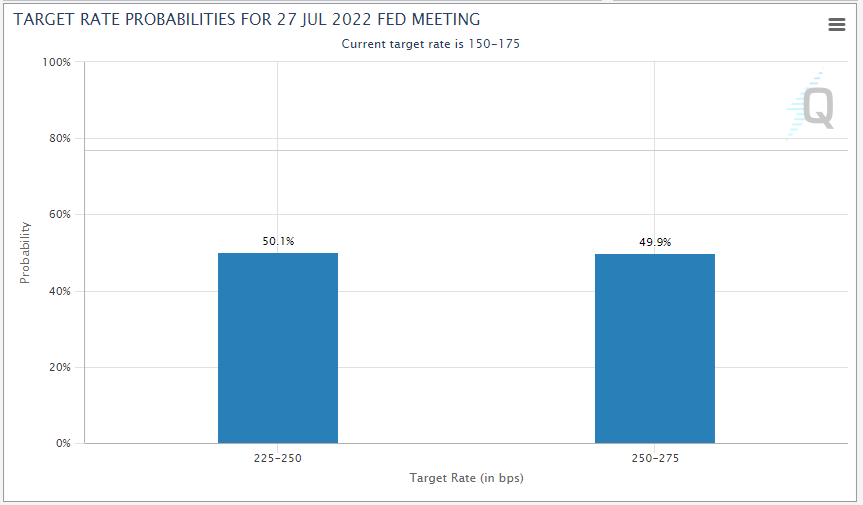
The logical, first-order effect of the hotter-than-expected inflation report was that it drove up expectations for near-term interest rate hikes from the Federal Reserve. Heading into this week, traders were pricing in just a 2% chance of a 100bps (1.00%) interest rate increase from the FOMC at its end-of-month monetary policy meeting, but as we go to press, the Fed Funds futures market is now pricing in coinflip odds of a 1% rate hike this month, per CME FedWatch:
Source: StoneX, TradingView
Between Fed members Barkin and Bostic seemingly endorsing a 100bps increase yesterday and the BOC making a similar move 90 minutes after the CPI report, strong economic data in the next couple of weeks could set the stage for the first 1.00% interest rate hike since the early 1980s; coincidentally that was the last time US inflation printed above 9% before yesterday’s print. Not surprisingly, the yield on short-term 2-year Treasuries rose 11bps yesterday as traders price in higher short-term rates from the US central bank.
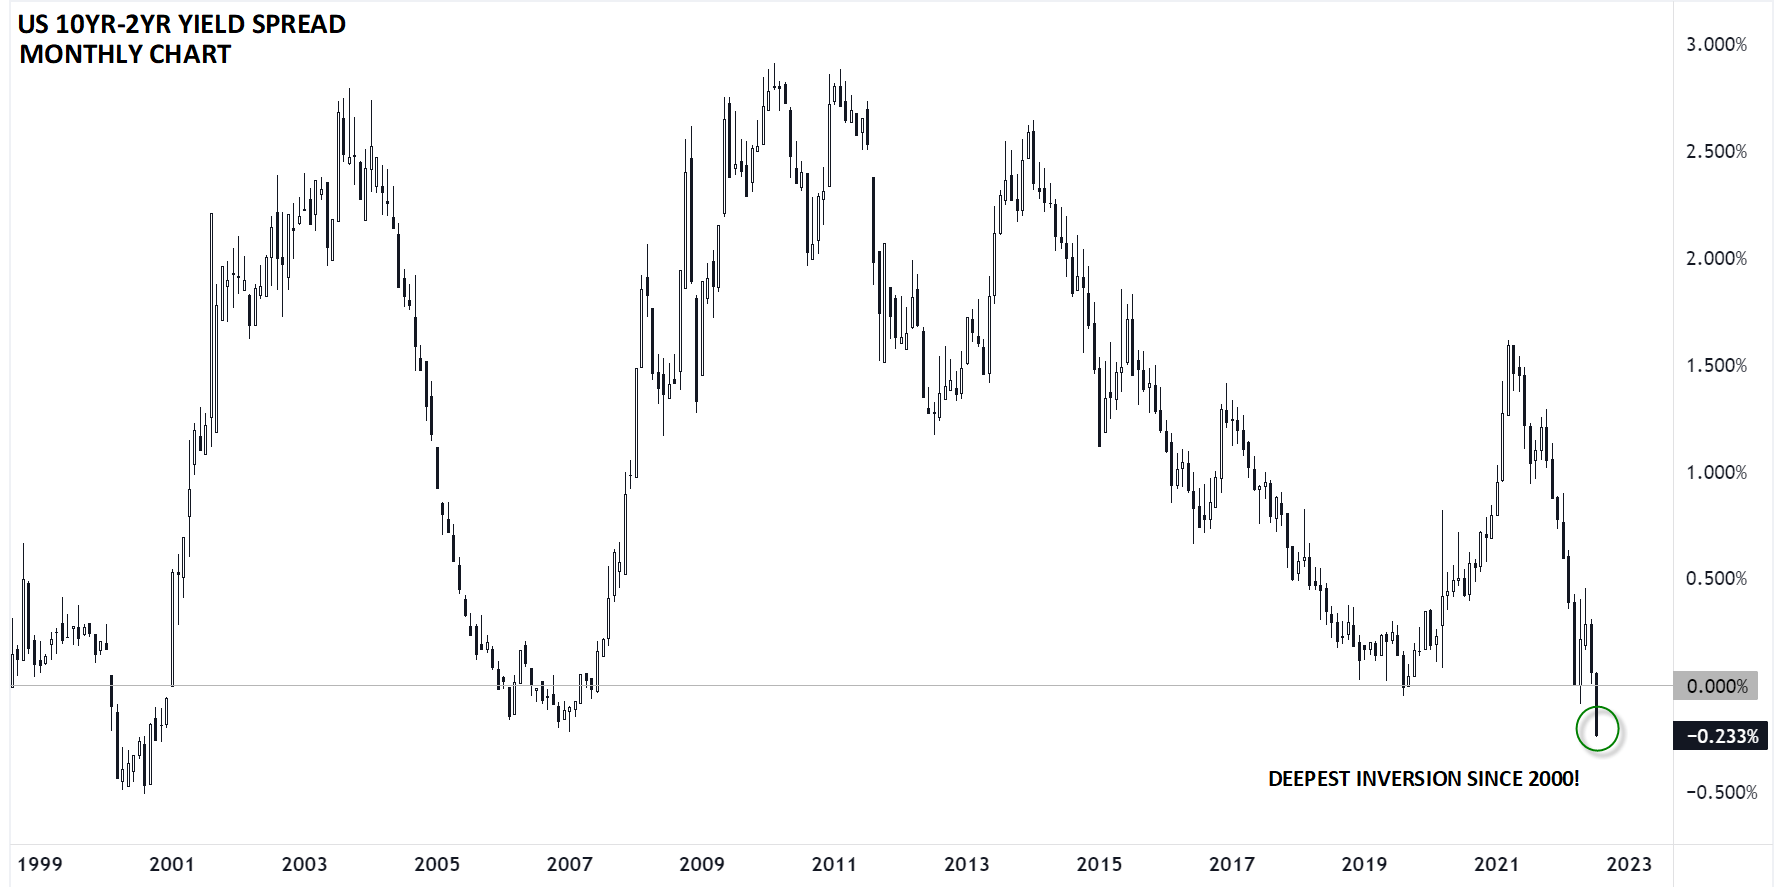
…But longer-term yields fell on recession and policy error fears
While the reaction in short-term yields has a tidy, reassuring explanation, this week’s move in longer-term yields is more ominous: The yield on the 10-year US Treasury bond is effectively flat since the US CPI report, driving the 10yr-2yr spread as low as -25bps, its deepest inversion since Q4 2000.
Source: StoneX, TradingView
As a reminder, so-called “inverted yield curves” have reliably predicted upcoming recessions for decades. Though it’s not necessarily causal, an inverted yield curve shows that the central bank, which has its biggest influence on short-term interest rates, may be raising rates past the appropriate neutral rate based on the market’s long-term expectations for growth and inflation; in other words, an inverted yield curve hints that the Fed risks throwing the US economy into a recession through a policy error. This view is becoming increasing widespread of late, with analysts from Bank of America to the IMF warning about downgrades too economic growth in the coming months.
Notably, the market is also implying that we may be cresting “peak inflation.” Either due to the Fed’s strong response to inflation or the long-awaited waning of “transitory” disruptions, traders are expecting US inflation to come in bang on the Fed’s 2% target based on 5-year, 5-year forward breakevens. Accordingly, Fed Funds futures traders are now pricing in more than 80bps of FOMC rate cuts in 2023:
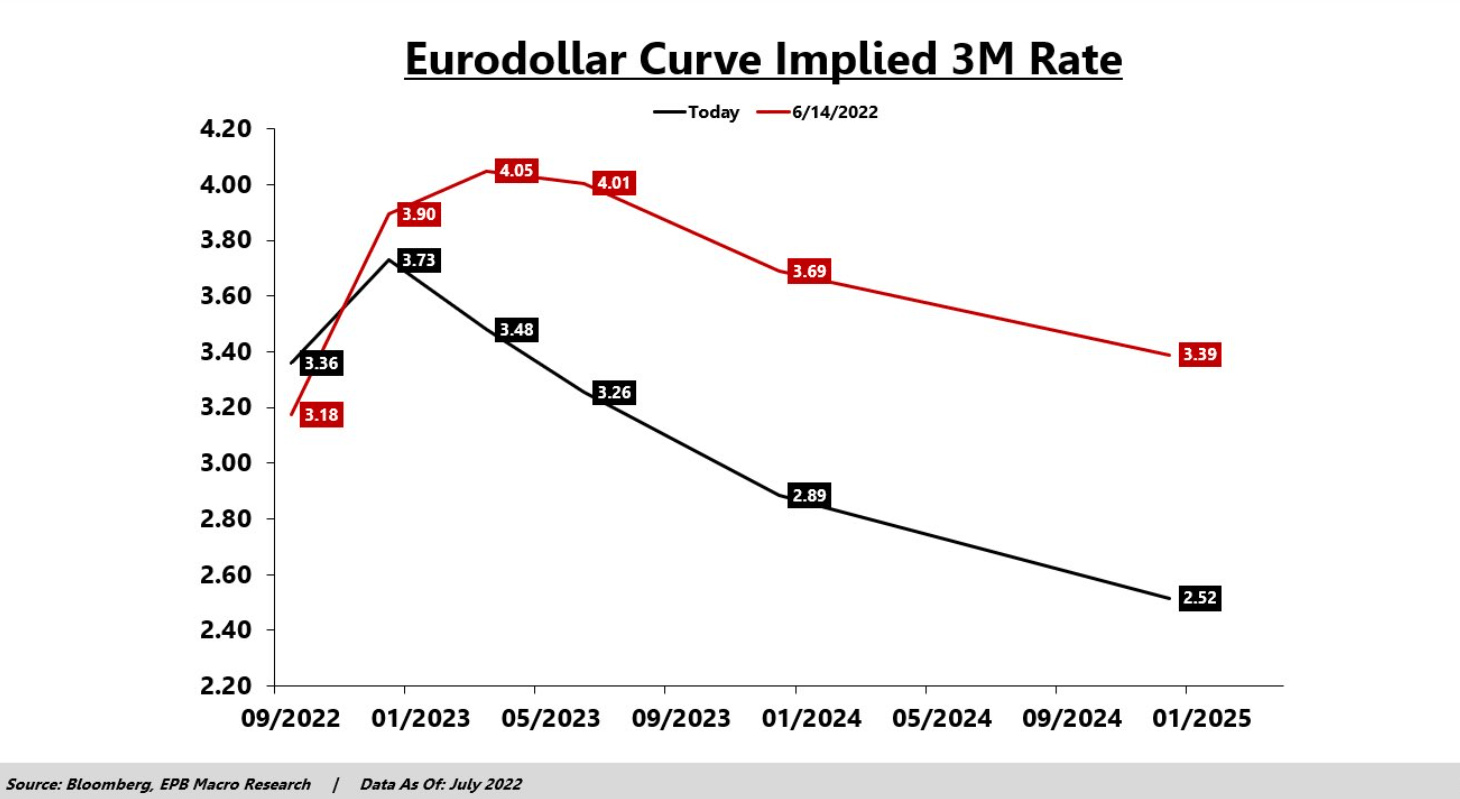
Source: Bloomberg, EPB Macro Research
Historically, interest rate hikes only have their biggest impact on real economic activity after 12-18 months, meaning that the Fed risks raising rates at exactly the wrong time as it continues to fight last year’s war.
What does the inverted yield curve mean for major markets?
When it comes to markets, the only constant is change, so the US (and global) economy may still skirt the recession that the yield curve is implying. That said, if we do see a recession, risk assets could still have further to fall.
Practically speaking, a global recession may lead to the following scenario:
- Global indices could see falls deeper into bear market territory as earnings dip (thus far, we’ve only seen P/E multiples contracting, not an outright decline in aggregate earnings).
- In the FX market, more growth sensitive currencies like the Australian and Canadian dollars may lose their year-to-date outperformance while the US dollar, once again, could benefit from a safe-haven bid and relatively high yields compared to its rivals.
- Finally, the selloff in commodities (which itself supports the slowing growth narrative) could extend as demand falls.
Of course, there is plenty of economic data to come and policy decisions to be made before the proverbial die is cast on a global recession, but if traders don’t have this scenario in their minds, they’re ignoring one of the biggest risk in markets right now.
How to trade with City Index
You can trade with City Index by following these four easy steps:
-
Open an account, or log in if you’re already a customer
• Open an account in the UK
• Open an account in Australia
• Open an account in Singapore
- Search for the market you want to trade in our award-winning platform
- Choose your position and size, and your stop and limit levels
- Place the trade
Latest market news
Today 08:33 AM
Latest Interest rates articles
March 7, 2024 03:34 PM
February 9, 2024 04:37 PM
December 13, 2023 08:10 PM
November 27, 2023 08:19 PM