


January 31, 2023 3:23 PM
Typically, the Employment Cost Index (ECI) for the prior quarter isn’t that big of a market mover. However, when Fed Chairman Jerome Powell specifically says that this is one of the most important indicators that the Fed watches to determine wage inflation, markets pay attention. The ECI for Q4 2022 was 1% vs an expectation of 1.1% and a 1.2% reading in Q3. This was the lowest level since Q4 2022. The Wages and Benefits components were both in-line with expectations at 1% and 0.8%, respectively, however they were also both lower than the Q3 readings. Combine the ECI with Average Hourly Earnings from November, which was revised lower from 0.6% MoM to 0.4% MoM, and December, which was 0.3% MoM vs 0.4% MoM expected, and the Fed is feeling pretty good about its soft-landing scenario. On Friday (after tomorrow’s FOMC meeting), the US will release Non-Farm Payroll data for January. Expectations are that the US added 185,000 new jobs to the economy vs 223,000 in December. The Average Hourly Earnings component is expected to remain at 0.3% MoM. Traders will be paying close attention to this data point due to the decreases in November and December. The big question everyone will be looking for Jerome Powell and gang to answer tomorrow is: Will there be signs that the Fed intends to hike by an additional 25bps at it March meeting?
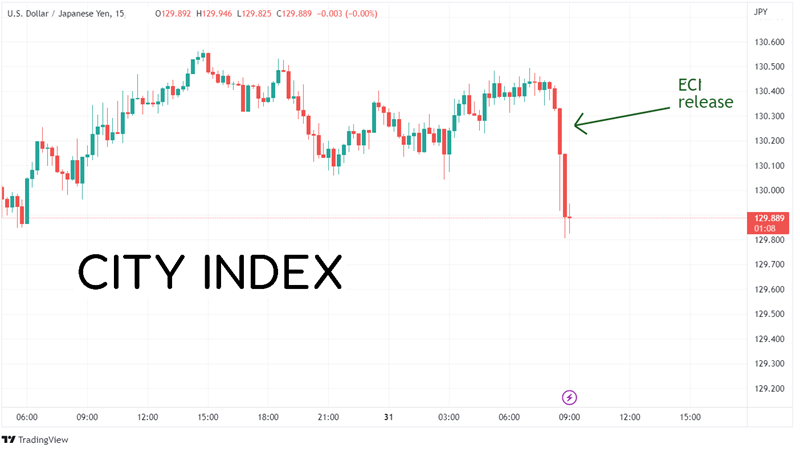
Upon release of the ECI, the US Dollar immediately dropped 40 pips in USD/JPY, below the 130.00 level.
Source: Tradingview, Stone X
Trade USD/JPY now: Login or Open a new account!
• Open an account in the UK
• Open an account in Australia
• Open an account in Singapore
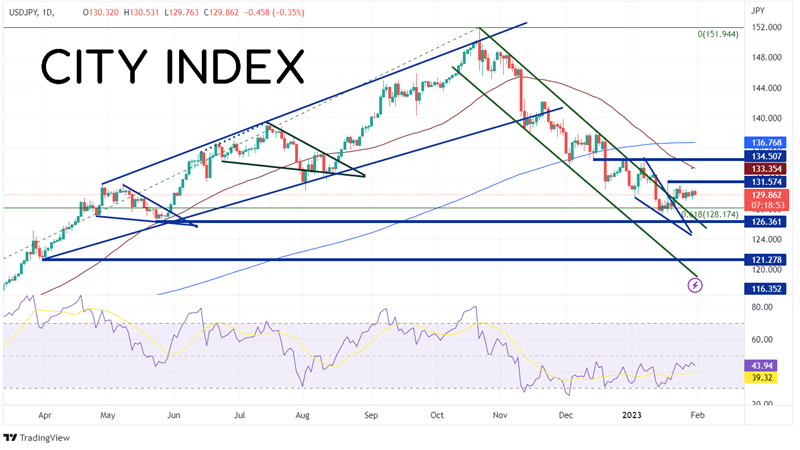
On a daily timeframe, there really wasn’t any damage done on USD/JPY to the technical picture after the release of the data. USD/JPY has been moving lower in an orderly downward sloping channel since October 21st, when the pair reached a high of 151.95. The pair reached the 61.8% Fibonacci retracement level from the lows of 2022 to the highs of 2022 at 128.17 on January 13th. USD/JPY had been forming a descending wedge since January 6th, and on January 20th, the pair began moving sideways out of both the long-term channel and the descending wedge. Since January 23rd, USD/JPY has been trading sideways between 129.04 and 131.11 as markets wait on the FOMC decision and statement on February 1st.
Source: Tradingview, Stone X
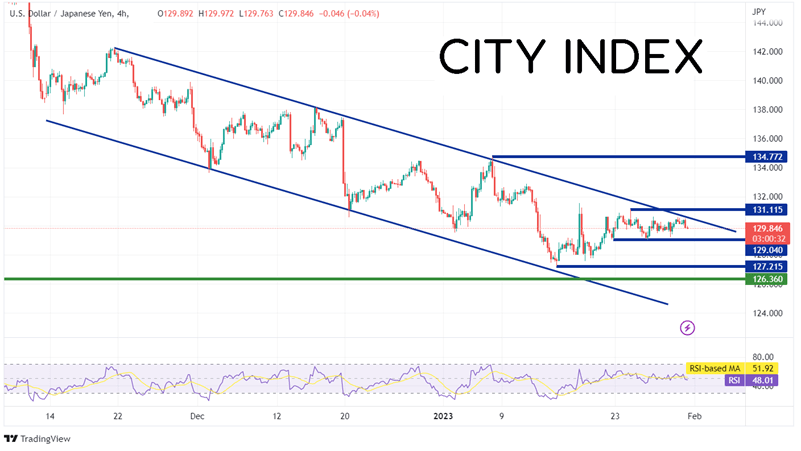
On a 240-minute timeframe, a smaller channel has formed dating to November 21st 2022. USD/JPY is currently nearing the top of that channel right now. Resistance is at the top trendline of the channel near 130.50. Above there, price can move to the highs form January 24th at 131.12, then the 50 Day Moving Average at 133.35 (see daily). However, if price moves lower, the first support is at the lows of January 22nd at 129.04. Below there, USD/JPY can move to the lows of January 16th at 127.33, then a confluence of support on the daily timeframe and the top downward sloping trendline and horizontal support dating to May 24th, 2022, at 126.36 (see daily).
Source: Tradingview, Stone X
Which way will USD/JPY resolve itself out of the tight range that the pair has been in for the last seven trading sessions? It may depend on the FOMC decision tomorrow. If the Fed believes that the lower ECI and Average Hourly earnings are enough to signal it is done hiking, USD/JPY should move lower. However, if the Fed is still worried about high inflation, USD/JPY may be on the move higher once again.
Learn more about forex trading opportunities.
Latest market news
Today 11:14 AM
Today 08:28 AM
Yesterday 03:30 PM
Latest Trade Ideas articles

Today 11:14 AM
Yesterday 11:00 AM
Yesterday 08:15 AM