


March 15, 2022 3:25 PM
The March FOMC interest rate decision meeting concludes tomorrow. (See our complete FOMC preview here). The February Producer Price Index (PPI) was the last piece of inflation data that the FOMC will see before the meeting concludes. The headline print was 10% YoY, in line with expectations. The bigger news is that the January print was revised from 9.7% YoY to 10% YoY, making the February print seem even stronger. This is the highest reading since 1981! The Core PPI print, which excludes food and energy prices, was 8.4% YoY, lower than the expectation of 8.7% YoY. However, the January print was revised higher from 8.3% YoY to 8.5% YoY. Keep in mind that the headline print does not yet include the large run up in oil prices that were saw in the first half of March after Russia invaded Ukraine.
Everything you need to know about the Federal Reserve
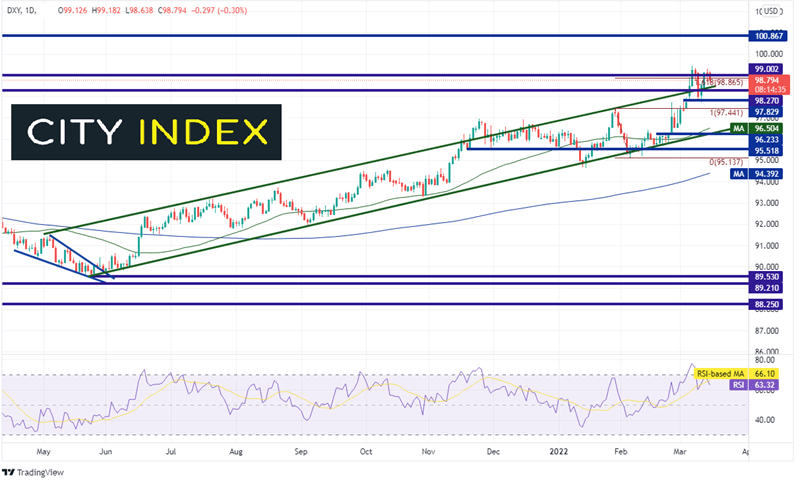
The US Dollar Index (DXY) has been moving higher in an orderly channel since late May 2021. Last week, the DXY reached its highest level since May 2020 at 99.42 as price traded above the top trendline of the channel. The Dollar Index tried to move back inside the channel late last week but failed. Resistance is holding thus far near the 161.8% Fibonacci extension from the highs of January 29th to the lows of February 4th near 98.96.
Source: Tradingview, Stone X
Trade the DXY now: Login or Open a new account!
• Open an account in the UK
• Open an account in Australia
• Open an account in Singapore
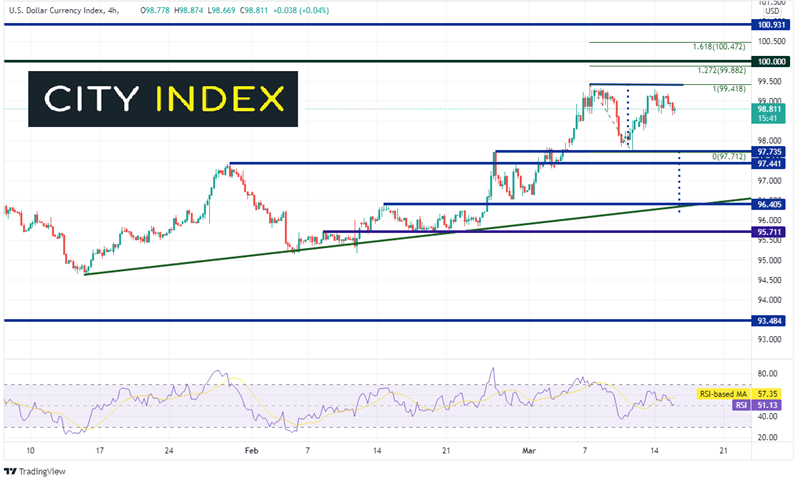
On a 240-minute timeframe, the price action of DXY may be setting up a double top. If price breaks support at 97.73, it will confirm a double top is in place and target 96.21 on the downside. However, if the DXY is to reach the target, it must first break through the support at 97.44. Below there is a confluence of support at the highs of February 14th and an upward sloping trendline dating to January 14th near 96.40. Notice on the daily timeframe that the 50-Day Moving Average comes in near those levels as well at 96.50. First resistance is at the March 7th highs of 99.42. Above there, resistance is at a confluence of the 127.2% Fibonacci extension from the highs of March 7th to the low of March 10th at 99.82 and the psychological round number resistance at 100.00. The 161.8% Fibonacci extension is the next resistance level near 100.47.
Source: Tradingview, Stone X
What is the Dollar Index (DXY)?
PPI was the last piece of inflation data that the Fed will get to see before it makes its decision on whether to hike interest rates tomorrow. However, the headline number was in line with expectations at a stubbornly high 10%. Although this print is very high, a single economic data point is unlikely to sway the Fed’s decision.
Learn more about forex trading opportunities.
Latest market news
Yesterday 03:30 PM
Yesterday 01:23 PM
Yesterday 11:00 AM
Yesterday 08:15 AM
Latest Trade Ideas articles
Yesterday 11:00 AM
Yesterday 08:15 AM
Yesterday 05:45 AM