


April 12, 2022 3:25 PM
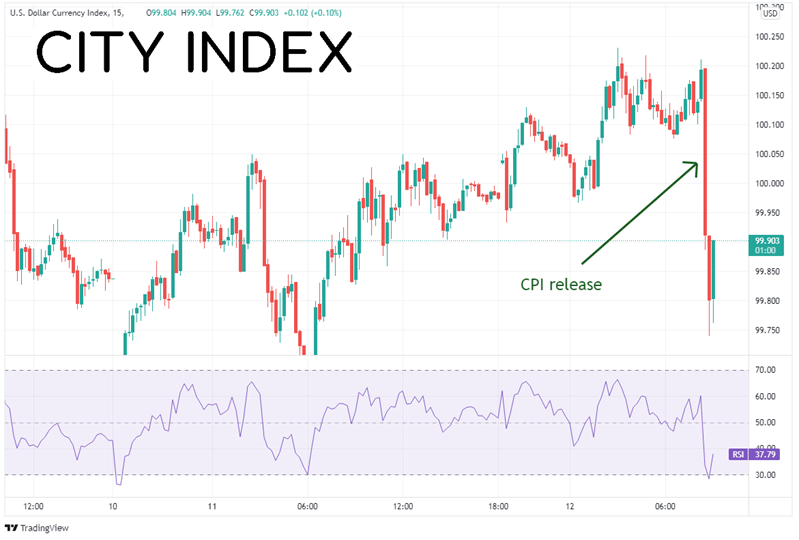
The US released March inflation data earlier today. The headline CPI print was 8.6% YoY vs 8.5% YoY expected and 7.9% in February. This was the highest inflation reading since December 1981! The large increase over last month’s reading was primarily due to an increase in food and energy prices. The core CPI for March, which excludes these volatile components, was “only” 6.5% YoY vs an expectation on 6.6% YoY and 6.4% YoY in February. This was the highest level since August 1982. These result help to further Fed Governor Evans claim from yesterday that a 50bps hike is highly likely at the May FOMC meeting.
Yesterday, the White House warned the markets that these numbers would be strong, which led many to believe they would be stronger than estimates. However, after the release of the data, the markets felt a sense of relief (fearing the prints could be worse) and the US Dollar moved lower. Price traded from 100.20 down to 99.74 before bouncing.
Source: Tradingview, Stone X
Trade DXY now: Login or Open a new account!
• Open an account in the UK
• Open an account in Australia
• Open an account in Singapore
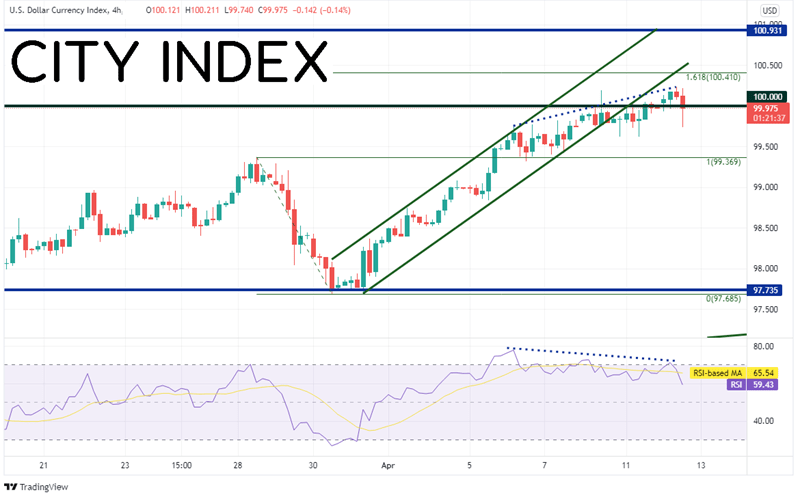
On a 240-minute timeframe, DXY has been moving higher in an orderly channel since March 31st. However, yesterday the US Dollar Index began moving sideways and traded out of the channel. Although it reached a near-term new high today at 100.23, the RSI is diverging, which was a signal price may have been ready for a pullback. Support is at the March 28th highs near 99.37. Below there, price can fall to the lows from March 30th at 97.74. First resistance is at the bottom trendline of the upward sloping channel and the 161.8% Fibonacci extension level from the highs of March 28th to the low of March 30th near 100.41. Above there price can trade to the highs from April 2020 at 100.93.
Source: Tradingview, Stone X
Trade EUR/USD now: Login or Open a new account!
• Open an account in the UK
• Open an account in Australia
• Open an account in Singapore
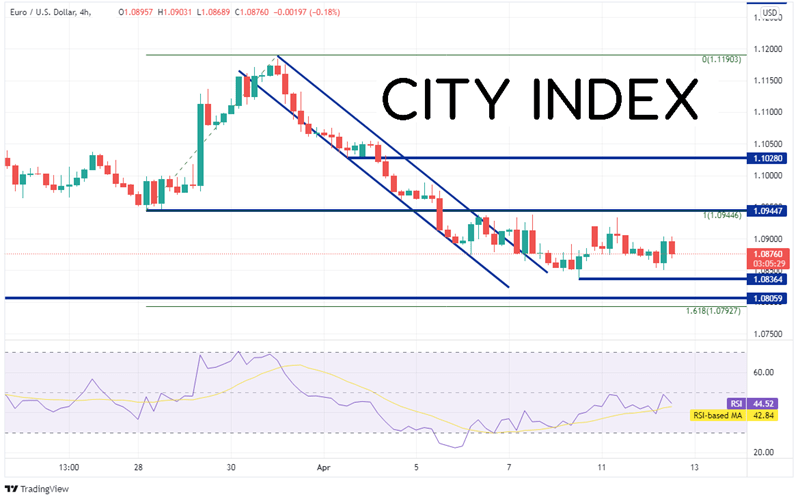
EUR/USD has been moving in a similar, but opposite direction of DXY. Price had been moving lower in an orderly channel since March 31st and traded sideways, out of the channel. However, unlike the DXY, EUR/USD did not make a new near-term low today. First support is at the lows from April 8th near 1.0836, then the lows from March 7th at 1.0806. Just below there, support is at the 161.8% Fibonacci extension from the lows of March 28th to the highs of March 31st, near 1.0792. Resistance is at the March 28th lows near 1.0945, then horizontal resistance at 1.1028. If price breaks above there, it can run to the highs of March 31st at 1.1190.
Source: Tradingview, Stone X
US CPI came in hot today! However, markets may have expected it, thanks to a warning from the White House yesterday. Therefore, traders may have sensed a little relief that the number wasn’t worse and markets did the opposite of what one may expect. Watch to see if the markets correct themselves over the next few days, especially if more talks of a 50bps hike at the May FOMC meeting begin to make the rounds!
Learn more about forex trading opportunities.


