


August 18, 2022 8:39 PM
US housing data released this week for July showed that the housing market is taking a breather as higher interest rates are leading buyers to sit on the sidelines to see if prices will come down. The NAHB Housing Market Index for August was only 49 vs 55 in July. This was the lowest reading since the pandemic lows in May 2020. In addition, Building Permits for July were -1.3% MoM vs +0.1% MoM in June, while Housing starts were -9.6% MoM vs +2.4% MoM in June. Finally, today, Existing Home Sales for July were -5.9% MoM vs -5.5% MoM in June. This was also the lowest level since May 2020. Finally, next week the US will release New Home Sales and Pending Home Sales. Analysts are expecting negative prints for both numbers as well.
Despite the weaker housing data, Fed officials spoke today about the possibility of hiking rates by 75bps at the September meeting. The Fed’s Daly said that she is concerned that core services inflation is still rising and that it was too early to declare victory on inflation, despite inflation at 8.5% YoY. In addition, the Fed’s Bullard said that he is leaning towards a 75bps rate increase in September. He is not ready to say that inflation has peaked and said it is important to get the target rate to 3.75% to 4.00% by the end of the year. The Fed’s George and Kashkari provided similar comments.
Everything you need to know about the Federal Reserve
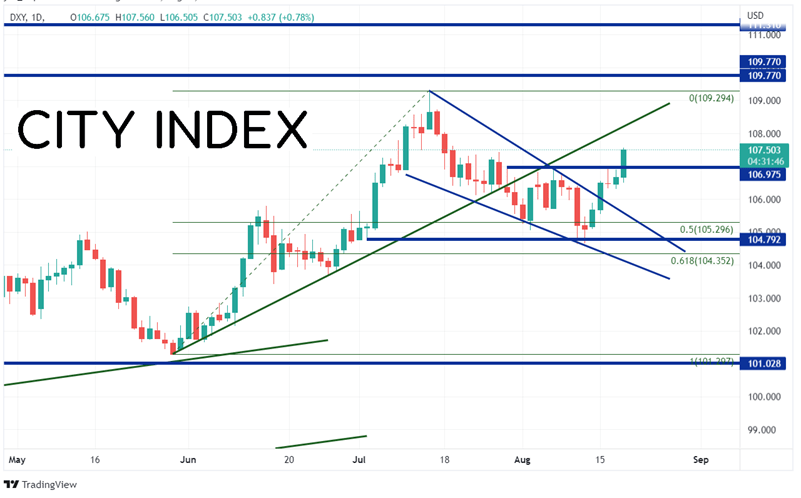
As a result of the hawkish Fed, the US Dollar Index is up nearly 1.00% today. The DXY has been moving aggressively higher since May 31st, when price reached a local low at 101.30. By July 14th, the US dollar reached a 20 year high of 109.24. Since then, the DXY pulled back in a descending wedge formation, breaking an upward sloping trendline dating back to May 31st. Price put in a low at 104.65 on August 11th, just above the 61.8% Fibonacci retracement level from the May 31st low to the July 14th high. Two days later, the DXY broke above the top downward sloping trendline on the descending wedge and ran into resistance at previous highs at 106.98. Today, the DXY broke above the resistance level and traded aggressively higher.
Source: Tradingview, Stone X
Trade USD/JPY now: Login or Open a new account!
• Open an account in the UK
• Open an account in Australia
• Open an account in Singapore
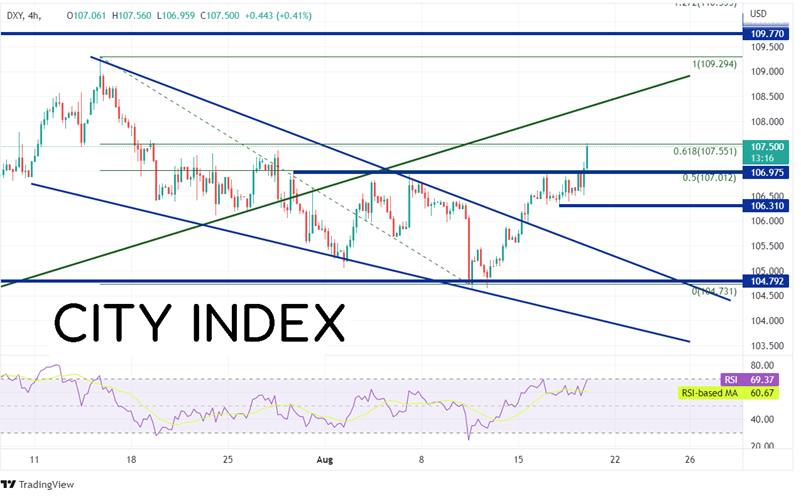
On a 240-minute timeframe, DXY is running into resistance at the 61.8% Fibonacci retracement from the highs of July 14th to the lows of August 10th near 107.55. Above there, the next level of resistance is at the green trendline from May 31st near 108.32, then the July 14th high at 109.30. First support below the recent highs is 106.31, which is the lows from August 7th. Below there, price can fall to the top trendline of the descending wedge near 105.50 and then the low from August 10th at 104.64.
Source: Tradingview, Stone X
US Housing data has been poor over the last month. However, the Fed is still of the mind that it needs to continue to hike rates due to high inflation. As a result, the US Dollar Index (DXY) has broken out today above horizontal resistance. Will it continue to move up towards the July 14th highs at 106.31? If the Fed insists on continuing to hike rates, it may be well on its way!
Latest market news
Today 08:33 AM
Yesterday 11:48 PM
Yesterday 11:16 PM
Latest Trade Ideas articles


Yesterday 11:48 PM