


January 10, 2023 4:00 PM
In general, inflation has been slowing over the last few months. On Thursday, markets will get a look at December’s CPI print. Expectations are that the headline print will continue to move lower to 6.5% YoY vs a November reading of 7.1% YoY. Last month’s reading was the fifth straight monthly decline after reaching a high of 9.1% YoY in June 2022. The print was also the lowest reading since December 2021. In addition, the Core Inflation Rate, which excludes food and energy, is expected to slow to 5.7% YoY vs a previous reading of 6% YoY. If the Core CPI comes out as expected, it will also be the lowest print since December 2021.
Markets have also now seen that wage growth is slowing. Average Hourly Earnings for December slowed to 4.6% YoY vs and expectation of 5% YoY and a lower November revised print of 4.8% YoY from 5.1% YoY. The Fed has been worried about wage growth, and this data was the first sign that wages may be rising at a slower pace.
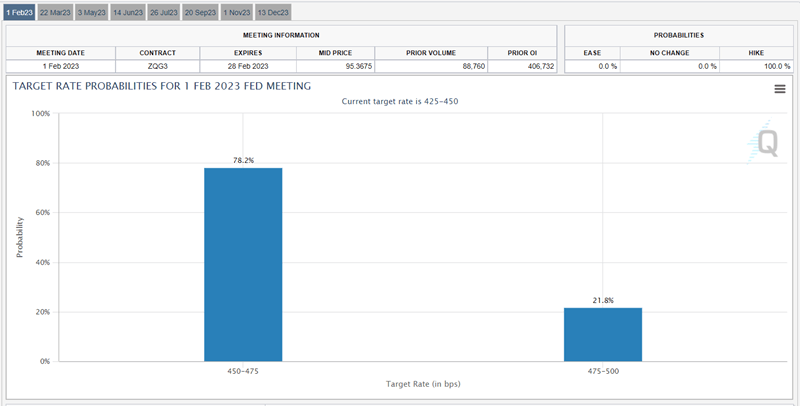
The risk to the markets is that the CPI data is weaker than expected. The Fed has already indicated in its Summary of Economic Projections that it expects the terminal Fed Fund rates to reach 5.1%. The current Fed Funds rate is 4.50%. If the inflation data is weaker than expected, markets may begin to price in a smaller chance of a rate hike at the February 1st meeting. According to the CME FedWatch Tool, markets are expecting a 78% chance of a 25bps rate hike and a 22% chance of a 50bps rate hike.
Source: CME
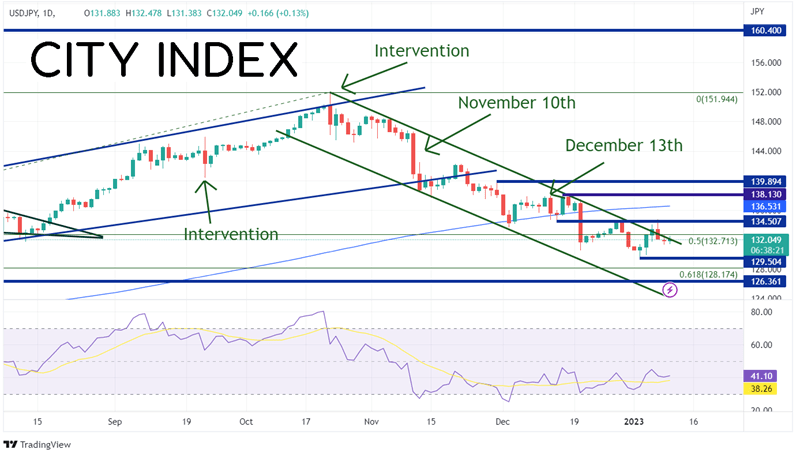
As has been the case, a lower-than-expected inflation reading should prove to be good for stocks and bad for the US Dollar. USD/JPY had been climbing into October 21st, as the MoF intervened for the second time in 2022 in the fx markets. The pair then began moving lower in an orderly channel. However, notice that when the lower-than-expected US CPI prints were released on November 10th and December 13th, the USD/JPY moved aggressively lower. The November 10th move fell 545 pips, more than on either of the intervention days!
Source: Tradingview, Stone X
Trade USD/JPY now: Login or Open a new account!
• Open an account in the UK
• Open an account in Australia
• Open an account in Singapore
On the daily timeframe, USD/JPY is currently trading at the top trendline of the channel. First support is at the 2023 lows from January 3rd at 129.50. The next support is at the 61.8% Fibonacci retracement level from the lows of 2022 to the highs of 2022 at 128.17. Below there, price can fall to the May 24th low at 126.36. If the CPI comes out inline or higher than expectations, USD/JPY may move higher. First resistance is at the highs from January 10th at 134.77. Above there, price can move to resistance at the 200 Day Moving Average near 136.53, then the highs from December 15th at 138.18.
The December US CPI reading is to be released on Thursday, January 12th. Inflation has been trending lower since the summer, but will it continue? If CPI continues to be weaker than expectations, watch for USD/JPY to continue to move lower if the US sells off.
Learn more about forex trading opportunities.
Latest market news
Yesterday 01:23 PM
Yesterday 06:01 AM
April 18, 2024 11:27 PM
April 18, 2024 04:46 PM
Latest Trade Ideas articles

April 18, 2024 11:27 PM
April 18, 2024 04:46 PM