


September 13, 2022 3:10 PM
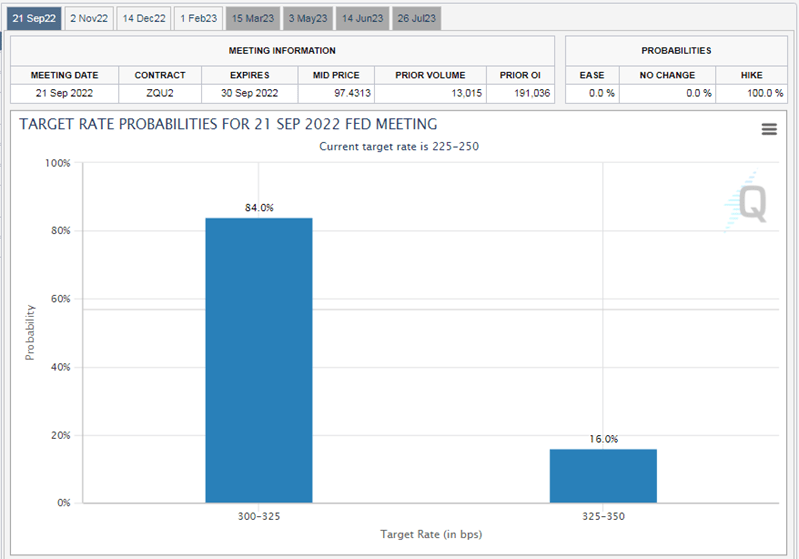
The US Consumer Price Index for August fell to 8.3% YoY vs an expectation of 8.1% YoY and a July reading of 8.5% YoY. However, the Core CPI is the print that traders are talking about. The August reading was 6.3% YoY vs and expectation of 6.1% YoY and a July reading of 5.9% YoY. The Core reading excludes food and energy prices. Therefore, today’s print would indicate that perhaps inflation isn’t contained to just the volatile food and energy components. It means that inflation has flowed into the prices of overall goods and services in the US economy. This has been the Fed’s biggest worry: that inflation would become “entrenched” in the economy. As a result of the data, not only does are the markets pricing in an 84% chance of a 75bps rate hike next week, but according to the CME’s FedWatch Tool, markets are also pricing in a 16% chance of a 100bps hike!
Source: CME
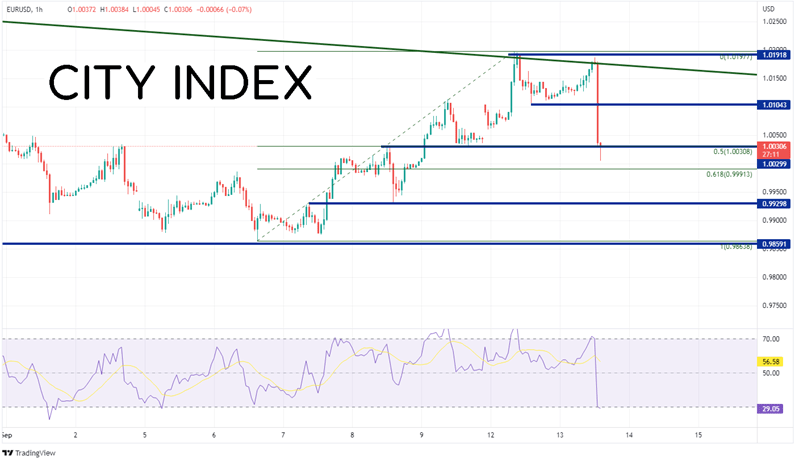
As a result of the higher than expected CPI data, the US Dollar jumped dramatically. On a 60-minute timeframe, EUR/USD had been trading near the top trendline of a long-term downward channel (green) below 1.0200. Immediately after the CPI print, the pair moved below the 50% retracement from the lows of September 6th to the highs of September 12th, near 1.0031. The next short-term support level is the 61.8% Fibonacci retracement level from the same timeframe near 0.9991. Below there, EUR/USD can fall to horizontal support at 0.9930 and then the September 6th lows at 0.9859. Intraday resistance is at 1.0104, then recent high and the top channel trendline at 1.1098.
Source: Tradingview, Stone X
Trade EUR/USD now: Login or Open a new account!
• Open an account in the UK
• Open an account in Australia
• Open an account in Singapore
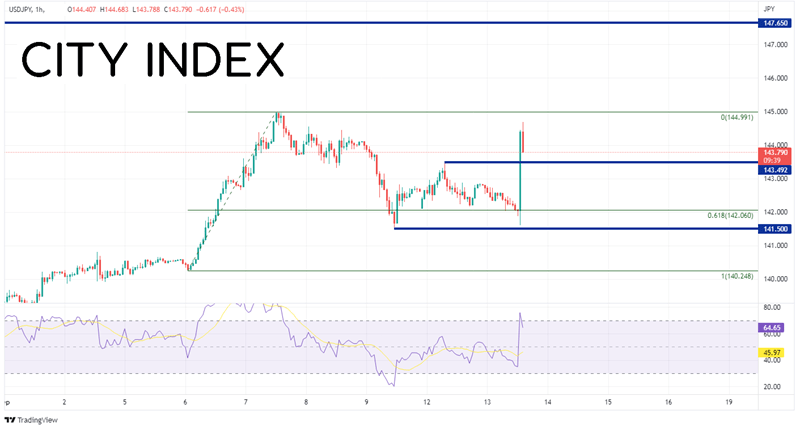
USD/JPY had the most dramatic move of the US Dollar currency pairs after the release of the CPI data. Price had been trading near the 61.8% Fibonacci retracement level from the lows of September 6th to the highs of September 7th, near 142. Immediately after the print, USD/JPY raced higher and made a high print of 144.68, a gain of nearly 270 pips! Notice on the short-term chart that the RSI moved immediately into overbought territory. Expect a pullback during the day (price has already pulled back nearly 90 pips.) Horizontal intraday support is at 143.49, then the lows of today near 141.59. Resistance is at the September 7th highs at 144.99. Above there, USD/JPY could move to the highs of 1998 at 147.65.
Source: Tradingview, Stone X
Trade USD/JPY now: Login or Open a new account!
• Open an account in the UK
• Open an account in Australia
• Open an account in Singapore
US August CPI came in hotter than expected, but the bigger surprise was the strength in the Core CPI reading. Will the Fed hike rates by at least 75bps? It’s almost certain. There is even a chance it may hike 100bps. The next economic data point the Fed will be watching is the University of Michigan Consumer Sentiment Index. If the inflation components are higher than expected, we may see another leak to the WSJ that the Fed will hike 100bps at its meeting next week!
Learn more about forex trading opportunities.
Latest market news
Today 08:15 AM
Today 05:45 AM
Latest Forex articles

Yesterday 11:09 PM
Yesterday 04:00 PM
Yesterday 04:19 AM