


July 28, 2022 6:57 PM
The US released its first look at Q2 GDP today and the headline print was -0.9% vs an expectation of +0.5% and a Q1 reading of -1.6%. In addition, the GDP Price Index for Q2 was 8.9% vs an expectation of 7.9% and a Q1 reading of 8.3%. But is the US in a recession? It depends who you ask! The textbook definition of a recession is 2 quarters of negative growth. However, many economists don’t abide by that rule, including Fed President Powell, who yesterday stated that he does not believe the US is in a recession. He said that a recession would require a slowdown in a number of sectors. Powell pointed out that a number of sectors are doing well, particularly the labor market. He also noted that today’s GDP number should be “taken with a grain a salt”, as this number tends to be revised over the next few months. So, whether we are in a recession or not, doesn’t really matter. The main point is that some sectors of the economy are slowing.
After yesterday’s FOMC meeting, in which it was pointed out that “recent indicators of spending and production have softened” and that the Fed will be determining rates on a meeting-to-meeting basis, the US Dollar began to sell off. With the negative GDP print today, the US Dollar began to move lower again. Markets are looking at the possibility of softer economic data during the month of July (to be released in August). The next FOMC meeting isn’t until September. This promotes a “risk-on” sentiment, as traders are looking at the prospect of a slower pace of rate increases moving forward.
See a complete recap of the FOMC meeting here.
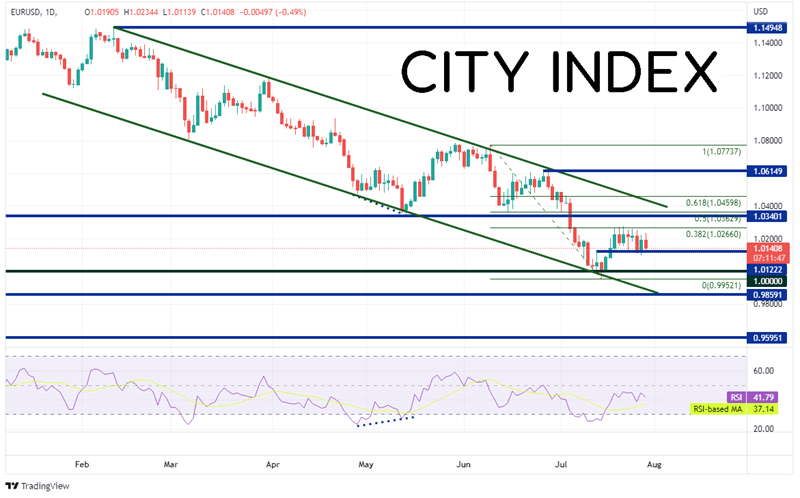
EUR/USD has been moving lower in a downward sloping channel since February. On July 14th, the pair poked below the bottom trendline of the channel, reaching a low of 0.9952. EUR/USD immediately bounced and retraced to the 38.2% Fibonacci retracement level from the highs of February 10th to the lows of July 14th, near 1.0266. Since July 19th, the pair has been trading in a range between horizontal support at 1.0122 and the 38.2% Fibonacci retracement level at 1.0266. Is it ready to break out?
Source: Tradingview, Stone X
Trade EUR/USD now: Login or Open a new account!
• Open an account in the UK
• Open an account in Australia
• Open an account in Singapore
On a shorter 240-minute timeframe, it appears that the pair may be forming a flag pattern after hitting the 50% retracement level from the highs of June 27th to the lows of July 14th near 1.0285. The first level of resistance is the top, downward sloping trendline of the flag near 1.0215. Above there, price can move to the highs from July 21st (and the 50% retracement level) at 1.0283. The next level of resistance is a confluence of resistance at strong horizontal resistance, the 61.8% Fibonacci retracement from the recently mentioned timeframe, and the target of the flag pattern, near 1.0340/1.3050. However, if price breaks down, the first support is at the bottom of the flag near 1.0085. Below there, EUR/USD could fall to the lows of July 14th at 0.9952.
Source: Tradingview, Stone X
The Q2 Advanced GDP print was weak at -0.9%. Does that mean the US is in a recession? It depends who you ask! However, one thing is for sure: If economic data continues to come out softer than expected, the Fed will slow the pace of its rate hikes moving forward. Tomorrow’s Core PCE will give the first clue.
Learn more about forex trading opportunities.
Latest market news
Yesterday 01:23 PM
Yesterday 06:01 AM
April 18, 2024 11:27 PM
April 18, 2024 04:46 PM
Latest Trade Ideas articles

April 18, 2024 11:27 PM
April 18, 2024 04:46 PM