


All the stock indices that we have covered have either reached their respective downside targets/supports or trading close to these supports at this juncture as per highlighted in our report published yesterday (click here for a recap).
The updated medium-term outlook (1-3 weeks) of these stock indices are presented below;
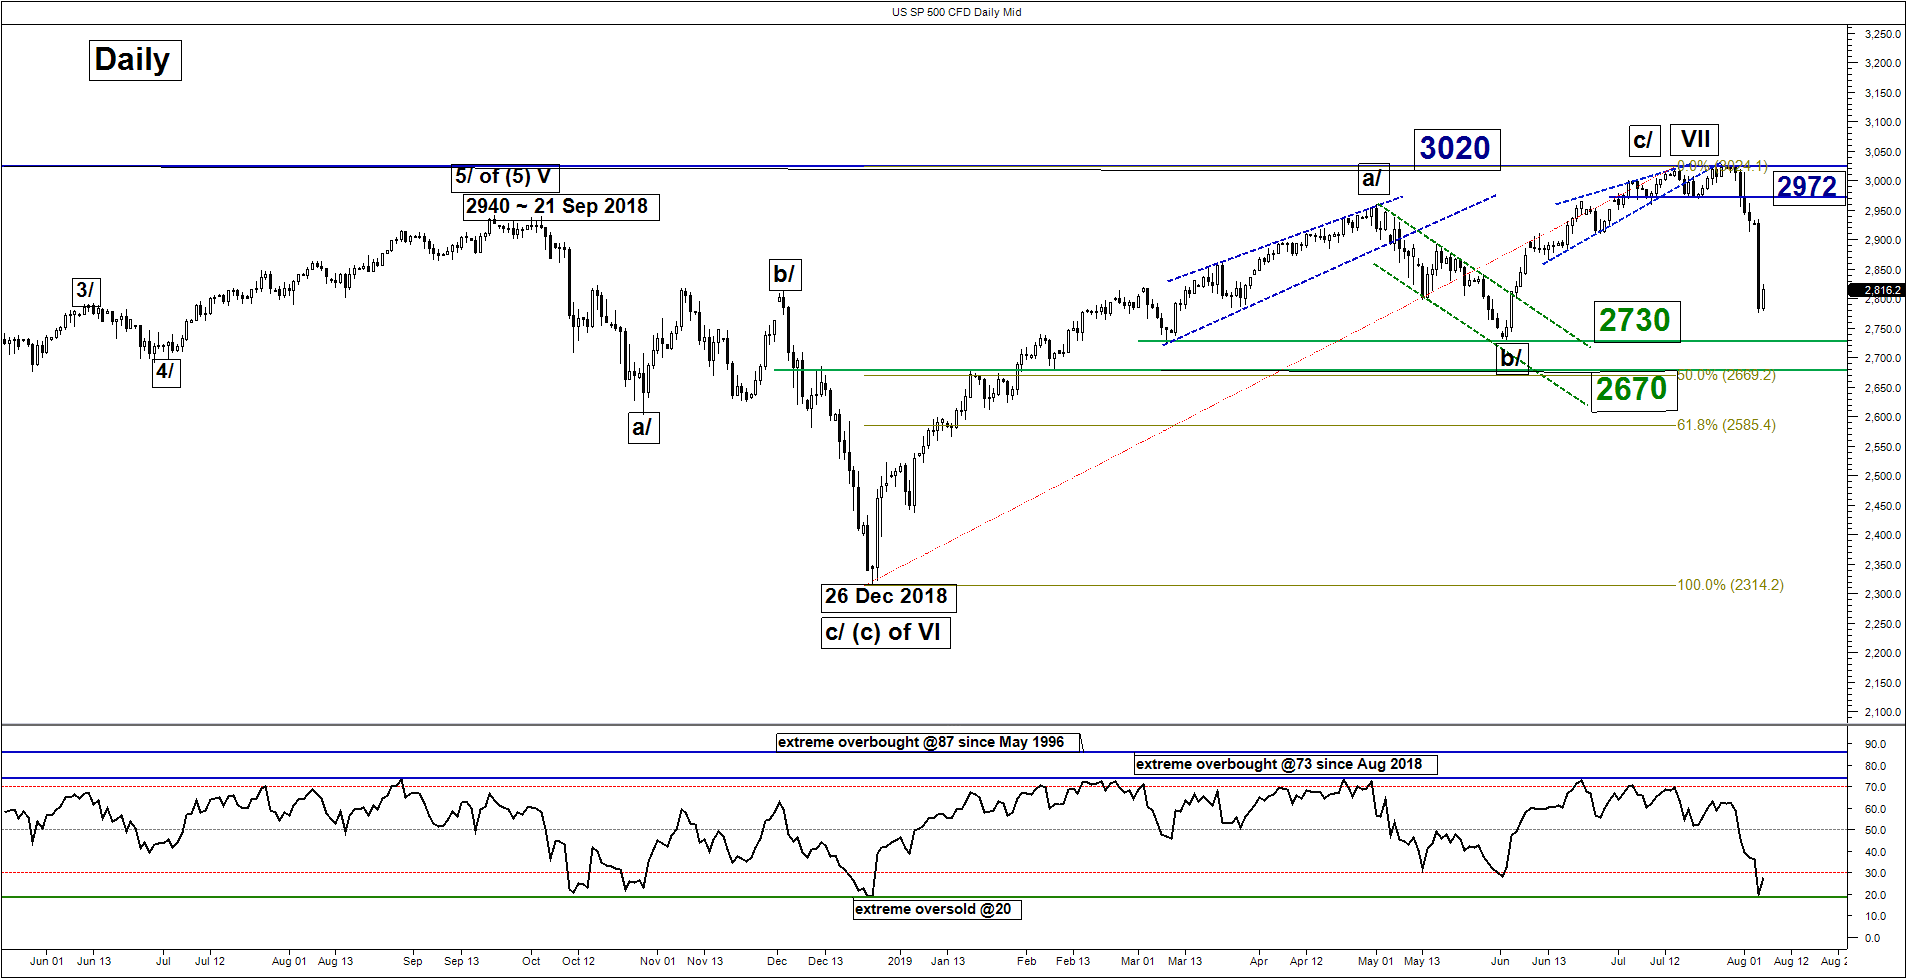
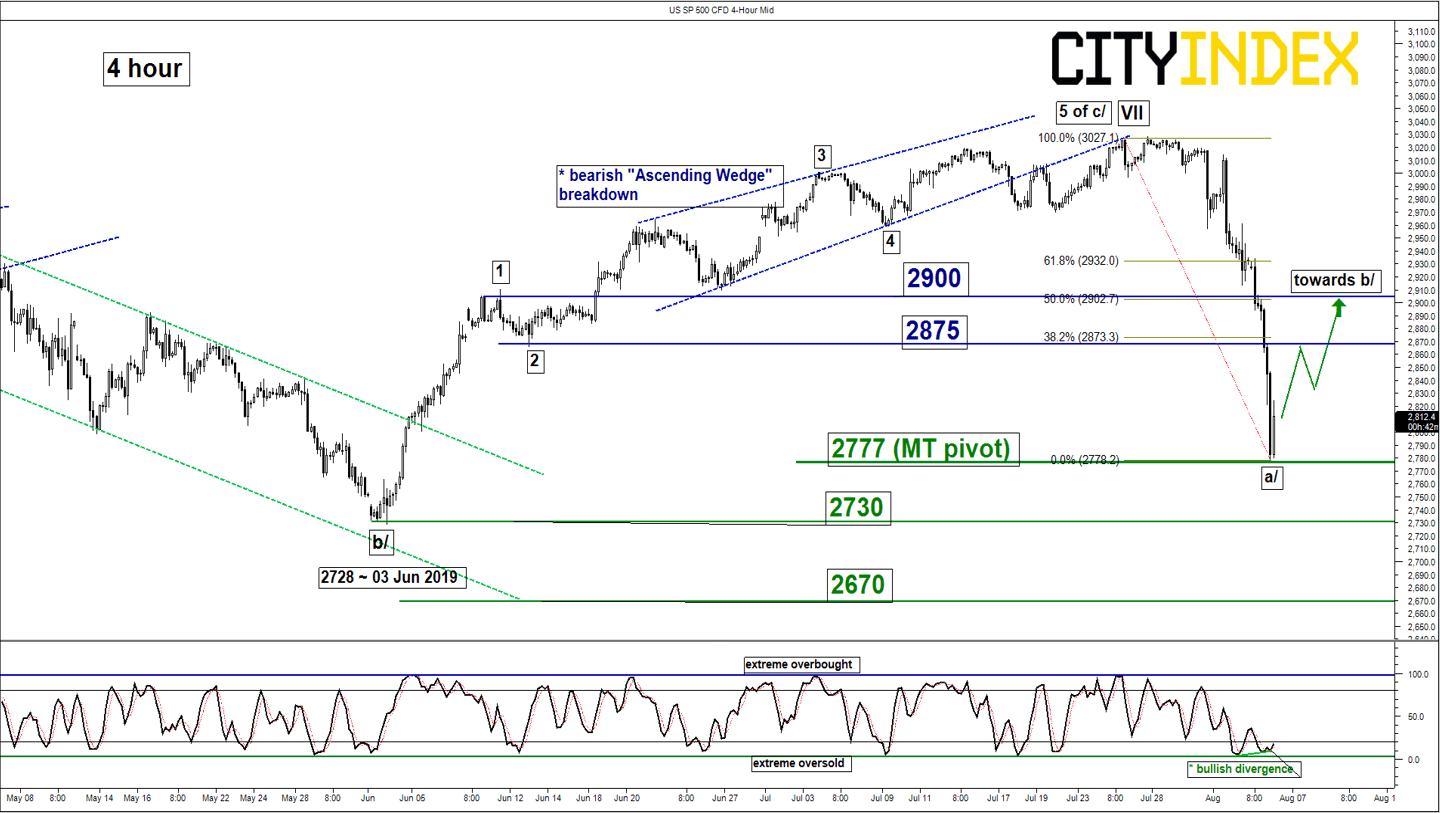
S&P 500 – Mean reversion rebound in progress
click to enlarge charts
Key Levels (1 to 3 weeks)
Pivot (key support): 2777
Resistances: 2875 & 2900
Next supports: 2730 & 2670
Directional Bias
Downside target/support met at 2845 on the SP 500 Index (proxy for the S&P 500 futures). In addition, downside momentum of price action has been overtreated as indicated by the extreme oversold readings seen in the daily RSI and 4-hour Stochastic oscillators. Flip to a bullish bias above 2777 key medium-term pivotal support for a mean reversion rebound to target the intermediate resistances of 2875 & 2900 within a corrective down move sequence still in motion since 25 Jul 2019 all-time high.
On the other hand, a break with a daily close below 2777 invalidates the mean reversion rebound scenario for the continuation of the down move towards 2730 and even 2670 next.
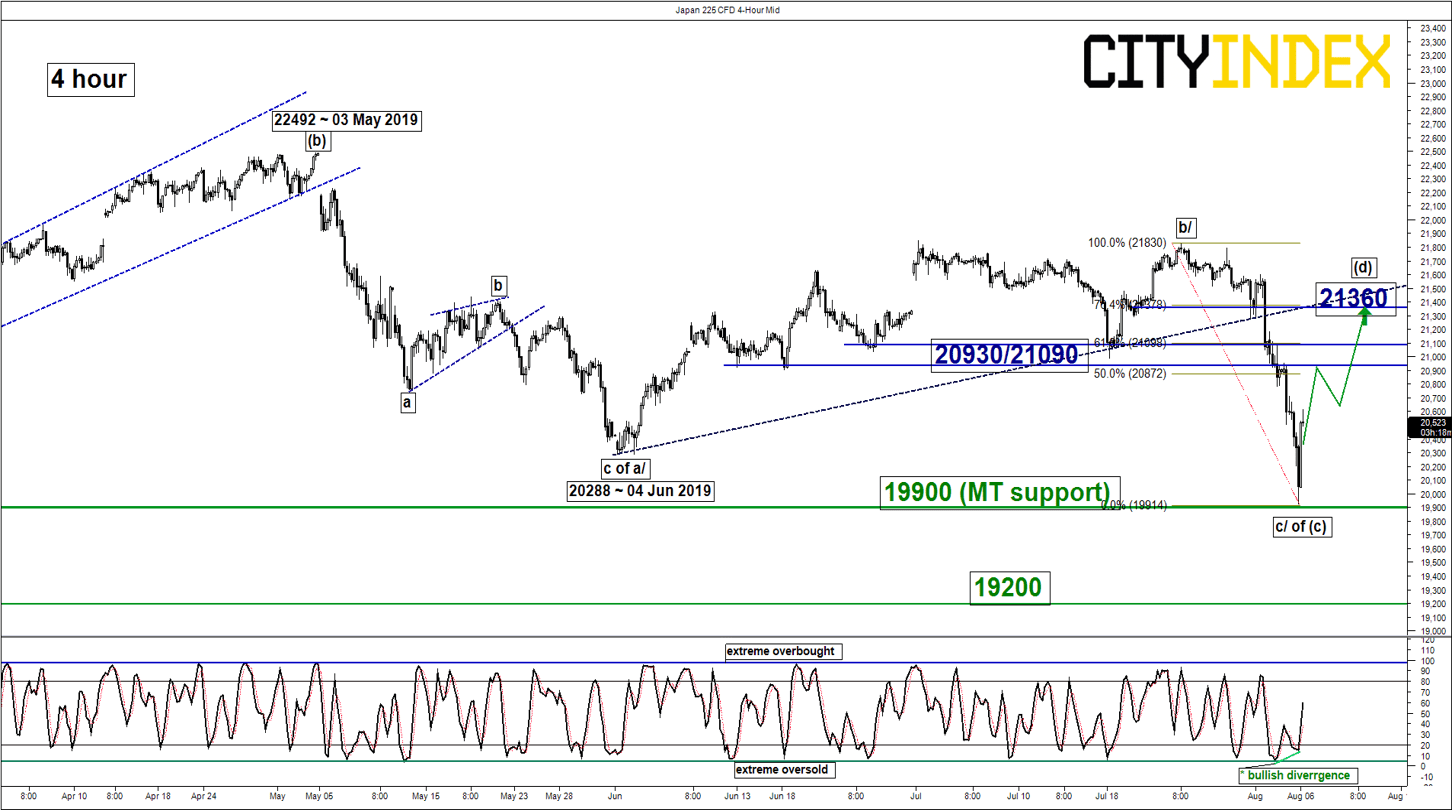
Nikkei 225 – 19900 key support to watch
click to enlarge chart
Key Levels (1 to 3 weeks)
Pivot (key support): 19900
Resistances: 20930/21090 & 21360
Next support: 19200
Directional Bias
Downside target/support almost met at 19655 on the Japan 225 Index (proxy for the Nikkei 225 futures). Flip to a bullish bias above 19900 key medium-term pivotal support for a potential corrective rebound to target the intermediate resistances at 20930/21090 and 21360.
On the other hand, a break with a daily close below 19900 invalidates the corrective rebound scenario for the continuation of the down move towards 19200.
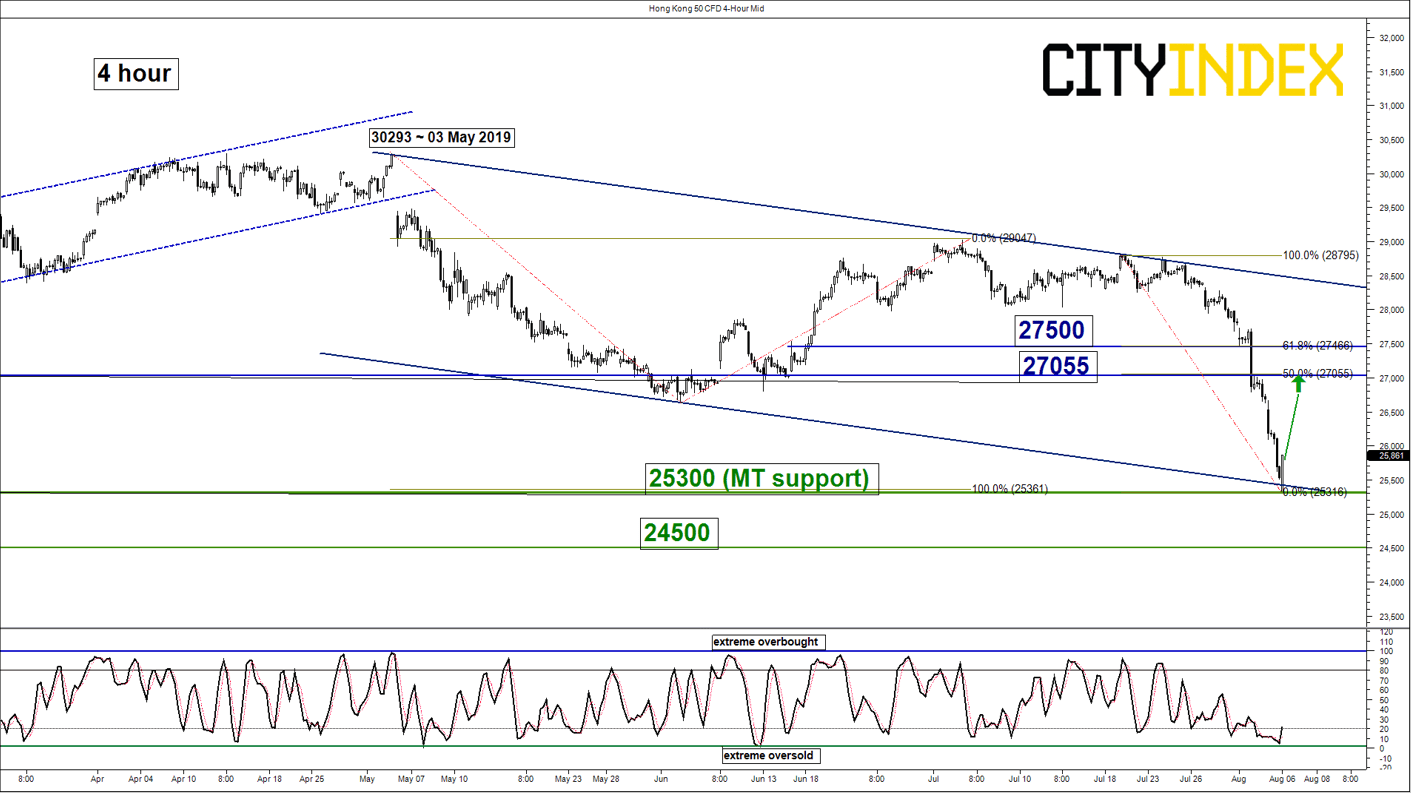
Hang Seng – Rebounding from descending channel support
click to enlarge chart
Key Levels (1 to 3 weeks)
Pivot (key support): 25300
Resistances: 27055 & 27500
Next support: 24500
Directional Bias
Downside target/support met at 25350 on the Hong Kong 50 Index (proxy for Hang Seng Index futures). Flip to a bullish bias above 25300 key medium-term pivotal support for a potential corrective rebound to target the intermediate resistance at 27055 with a maximum limit set at 27500 (61.8% Fibonacci retracement of the steep decline from 19 Jul high to 06 Aug 2019 low).
On the other hand, a break with a daily close below 25300 invalidates the corrective rebound scenario for the continuation of the down move towards 24500 (26 Oct 2018 swing low area).
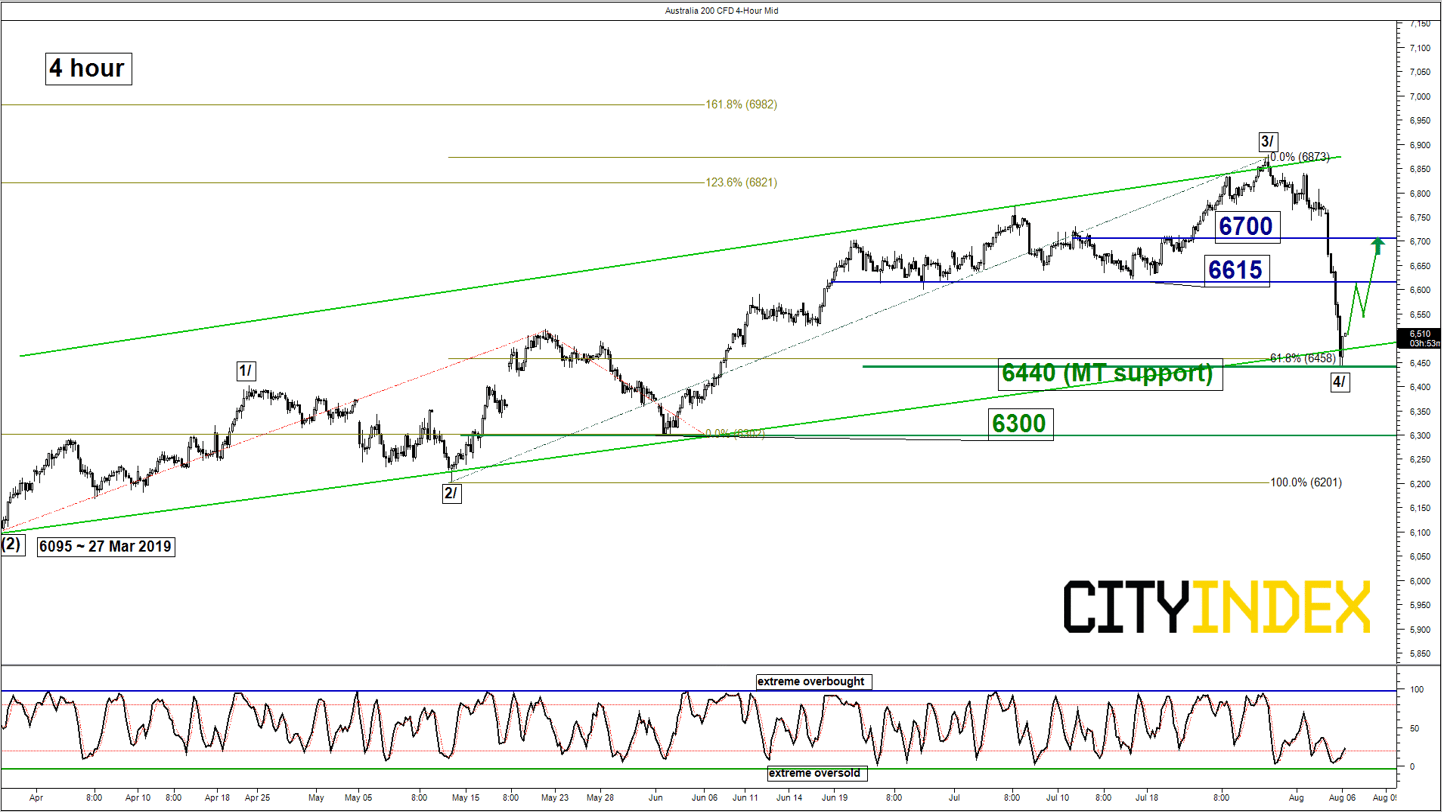
ASX 200 – Rebounding from ascending channel support
click to enlarge chart
Key Levels (1 to 3 weeks)
Pivot (key support): 6440
Resistances: 6615 & 6700
Next support: 6300
Directional Bias
Downside target/support met at 6540 on the Australia 200 Index (proxy for the ASX 200 futures). Flip to a bullish bias above 6440 key medium-term pivotal support for a potential recovery to target the intermediate resistances at 6615 and 6700.
On the other hand, a break with a daily close below 6440 invalidates the recovery scenario for the continuation of the down move towards 6300 in the first step.
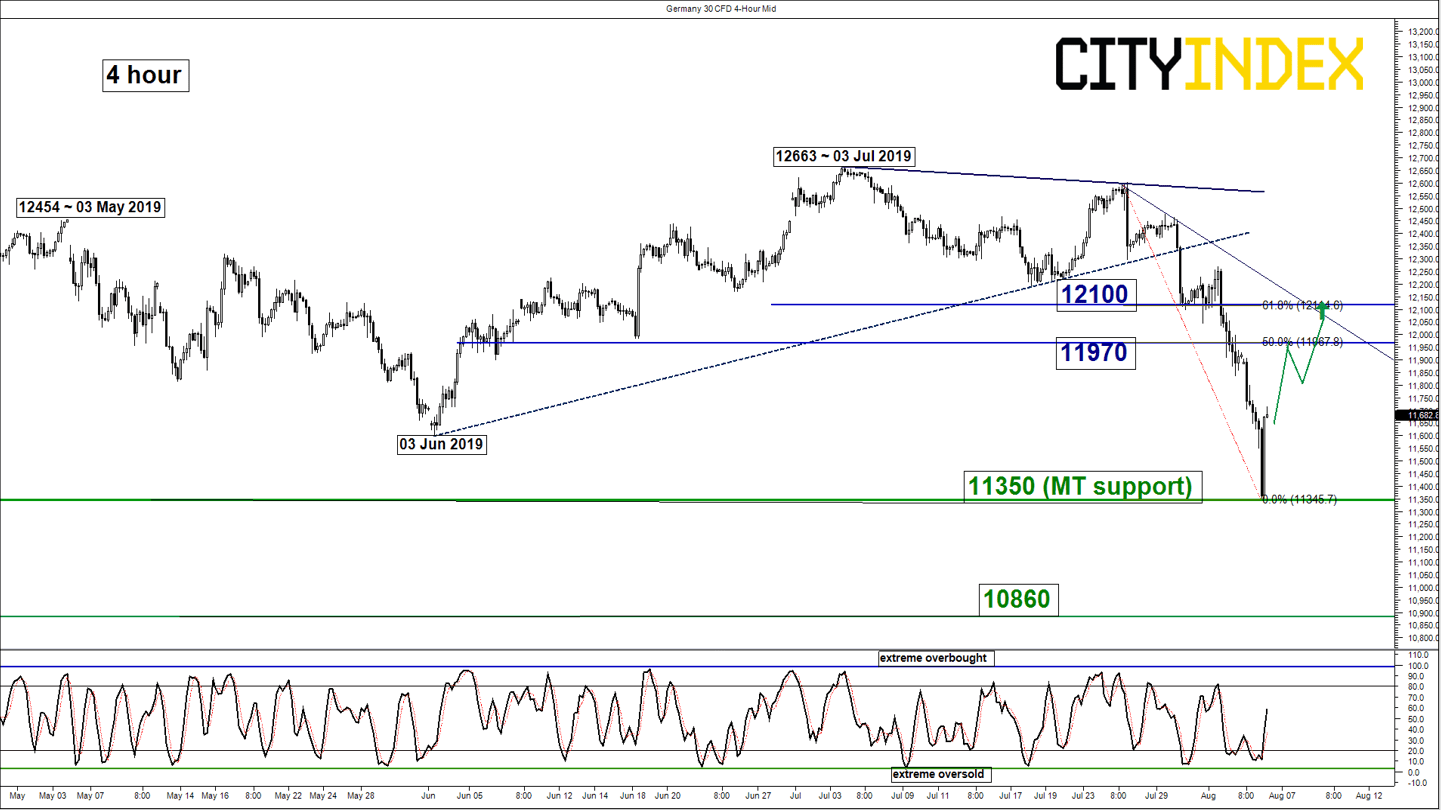
DAX – 11350 key support to watch
click to enlarge chart
Key Levels (1 to 3 weeks)
Pivot (key support): 11350
Resistances: 11970 & 12100
Next support: 10860
Directional Bias
Downside target/support met at 11300 on the Germany 30 Index (proxy for the DAX futures). Flip to a bullish bias above 11350 key medium-term pivotal support for a potential mean reversion rebound towards the intermediate resistances at 11970 and 12100 (also 61.8% Fibonacci retracement of the steep decline from 25 Jul high to 06 Aug 2019 low).
On the other hand, a break with a daily close below 11350 invalidates the recovery scenario for the continuation of the down move towards 10860 (08 Feb 2019 swing low & close to 76.4% Fibonacci retracement of the previous multi-month up move from 26 Dec 2018 low to 03 Jul 2019 high).
Charts are from City Index Advantage TraderPro
Latest market news
Yesterday 01:23 PM
Yesterday 06:01 AM
April 18, 2024 11:27 PM
April 18, 2024 04:46 PM
Latest Australia 200 articles
February 15, 2024 11:33 PM
February 15, 2024 01:42 AM
February 14, 2024 05:39 AM