


Uber releases hotly anticipated second quarter earnings shortly. Here’s a re-cap of what to look for
Our full preview for Uber’s second quarter earnings was published on Wednesday. Read it here.
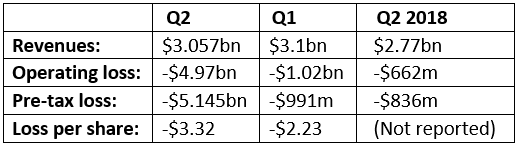
Key Financial points to Watch
Key Q2 Metrics to Watch
- Core platform gross bookings are forecast to rise to $15.53bn in Q2 vs. $14.52bn in Q1
- Growth is forecast to fall to 32% from 34% in Q1
- Q2 2018 and Q1 2018 growth was 48% and 56%
Other key points to watch
- Uber may confirm that it is selling Uber Eats India
- It may comment on Takeaway.com’s £5bn agreement to buy Just Eat
Possible share price reaction
- Shares remain below IPO price
- The stock jumped as much as 7.5% on Thursday after Lyft’s better than expected earnings earlier this week
- An upside surprise in Uber’s results could deliver a positive-shock to shares
- Missing forecasts, or just meeting expectations could send the shares lower
- Options pricing shows a high put/call ratio and skew. These point to bearish sentiment
- 19% of the stock is held by short sellers betting the price will decline
Chart thoughts
- Uber is in an upswing from its post-IPO gap fill. There are decent technical signs of a change in sentiment
- Downward velocity that followed a rejected attempt to approach 28th June’s primary cycle high has dissipated
- The stock escaped a falling channel this week
- A fresh cycle low was established at $38.20 on Wednesday; closely echoing several lows nearby
- $39.24 may be significant support as it was the top price on Uber’s first post-IPO Monday, 13th May. It was also the bottom of the gap after Uber’s 10th May debut
- The 8th July swing low of $42.75 established a floor for most of that month. It’s now resistance
- Added significance (‘confluence’) comes from proximity to 61.8% of the 29th July-7th August
- Since Uber has settled at resistance just ahead of earnings, current levels are a rough marker. They can define sentiment: Above here signals well-received figures; below would be negative
- If the stock escapes its 26th June bearish outside day range–even better
- The bottom of that range—$42.36—adds support
- Failure to break above current resistance will return Uber to a downward course
- In that case, assuming no help from the 38.2% Fibonacci, expect another visit to $39.24; perhaps $38.32
Uber Technologies Inc. – 120 minutes [08/08/2019 19:52:03
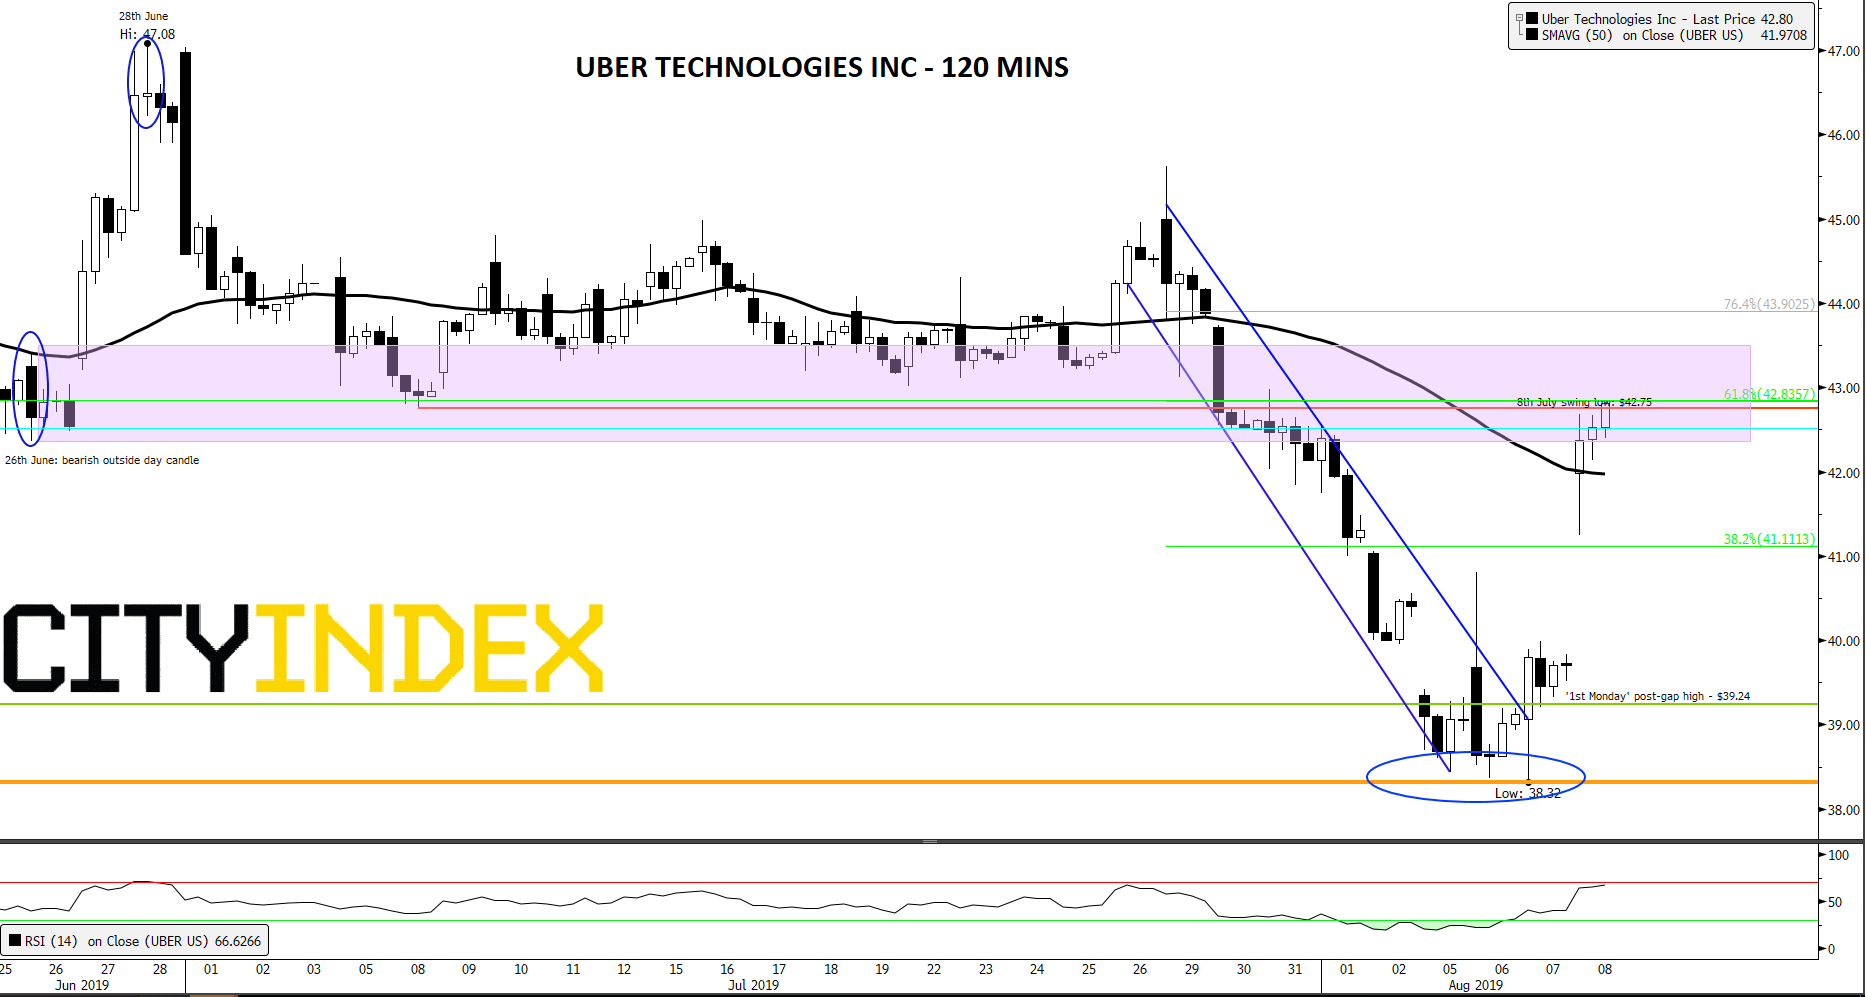
Source: Bloomberg/City Index
Latest market news
Yesterday 11:09 PM
Yesterday 11:01 PM
Yesterday 04:00 PM
Yesterday 01:15 PM
Yesterday 11:30 AM
Latest Shares market articles
November 2, 2023 01:41 PM
November 1, 2023 01:33 PM
October 31, 2023 01:15 PM
October 31, 2023 10:24 AM