


Oil rises after EU oil ban
Oil prices are rising for a sixth straight session and are set for a sixth consecutive month of gains, its longest run of gains in a decade, after EU leaders finally approved to ban on Russian oil imports and as China re-opens.
Oil prices rose to a fresh two-month high after the latest round of sanctions from the EU included a 90% ban on Russian oil imports after modifying the deal to get Hungary onside. The new agreement is watered down from the original proposal, but the impact is still likely to be meaningful and will keep oil prices elevated.
The move comes as China relaxes lockdown restrictions which is also helping the demand side of the equation, and as the US enters peak driving season.
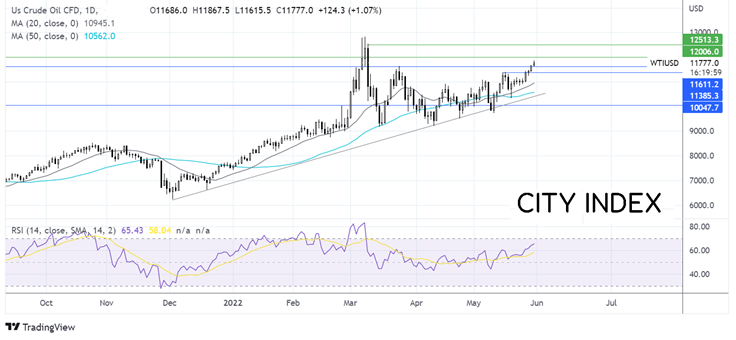
Where next for oil prices?
Oil prices have extended the rebound from the 50 sma, retaking several key resistance levels. The rise above 116.30 coupled with the bullish RSI suggests that there could be more upside to come.
Buyers will look for a move over 120.00 round number to bring 125.40 into play, the March 9 high.
Support can be seen at 116.30, the March 23 high, with a break below here opening the door to 114.00, the May 16 high.
EURGBP edges lower ahead of EZ inflation data
EURGBP is edging lower after solid gains in the previous session. The pair is set to gain 1.5% across the month.
Attention will be on Eurozone inflation data which is expected to rise to a record high of 7.7% YoY in May, up from 7.4% in April. After both Germany and Spain saw inflation jump above expectations to 7.9% and 8.7%, respectively.
The data comes as the ECB adopted a more hawkish stance towards monetary policy last week, with a 25 basis point rate hike now expected in July and September.
The pound has traded under pressure recently as the partgygate scandal sees pressures mounting on PM Boris Johnson to resign.
There is no high impacting UK data due today.
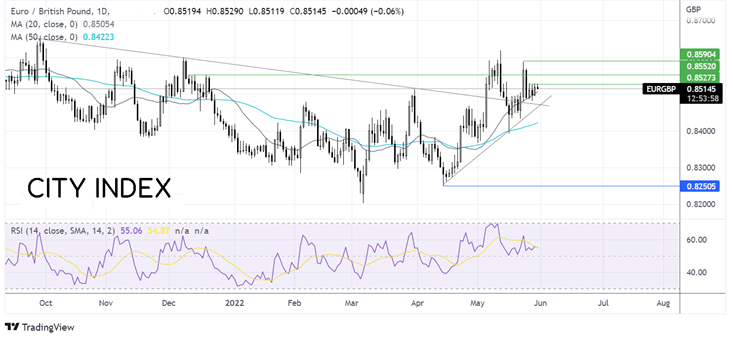
Where next for EURGBP?
EURGBP rebounded from 0.8480 and consolidates between 0.8505 the 20 sna and 0.8530. The RSI is above 50, suggesting that there could be more upside to come.
Buyers will look for a move over 0.8530 to push higher towards -0.8550, a level that limited the upside on several occasions in December. A break above here could bring 0.8590, the May 24 high, into play.
On the downside, sellers could look for a close below the 20 sma at 0.8505 to bring 0.8470 into the target. This is the confluence of the multi-month falling trendline support and the 6-week rising trendline, which could prove a tough nut to crack.
How to trade with City Index
You can trade with City Index by following these four easy steps:
-
Open an account, or log in if you’re already a customer
• Open an account in the UK
• Open an account in Australia
• Open an account in Singapore
- Search for the market you want to trade in our award-winning platform
- Choose your position and size, and your stop and limit levels
- Place the trade
Latest market news
Today 08:18 AM
Yesterday 10:40 PM
Latest Trade Ideas articles
Today 08:18 AM