


EUR/GBP looks to inflation data, BoE speakers
- Eurozone inflation expected to confirm 8.6% YoY
- BoE speakers & Brexit in focus
- EUR/GBP tests support at 0.88
EUR/GBP holding study around 0.88, after modest gain in the previous session and as investors look ahead to eurozone inflation data which is the major release across the European session.
Expectations are for inflation to confirm the preliminary print of 8.6% YoY, down from 9.2% in December. This is the second reading, so it is not considered as market leaving as the preliminary print.
Recent data from the eurozone has been strong, indicating that the region could avoid a recession. The upbeat data supports the hawkish stance of the ECB, which is expected to hike rates by 50 basis points again in the March meeting.
The pound charged higher earlier in the week after an impressive return to growth by the private sector, easing recession fears. Since then, sterling has drifted amid a lack of fundamental drivers and with the Northern Ireland protocol still hanging in the balance.
Today there is no high impacting UK economic data. Instead, traders will be looking at speeches by BoE policymakers Catherine Mann and John Cunliffe.
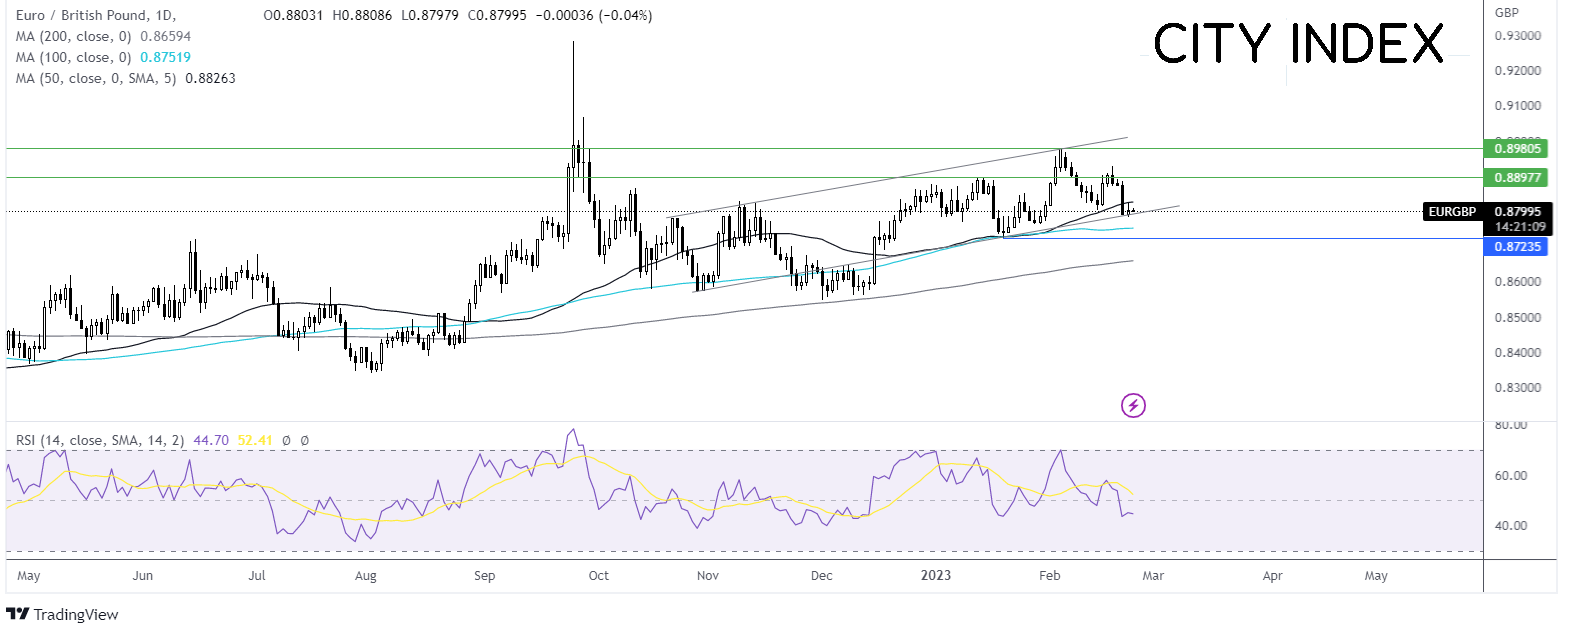
Where next for EUR/GBP?
After rebounding lower from 0.8980, EUR/GBP aggressively broke below the 50 sma, which, combined with the RSI below ,50 keeps sellers hopeful of further downside.
Sellers are testing support at 0.88, the rising trendline, with a break below here needed to expose the 50 sma at 0.8750. The price has traded above the 50 sma since mid-December. Below here, support can be seen at 0.8720, the 2023 low.
On the flip side should buyers successfully defend the rising trendline support, buyers will first look for a move over 0.8830 the 50 sma to bring 0.8890, the weekly high into focus.
S&P500 rises post FOMC minutes & ahead of US GDP data
- S&P rises as markets get used to higher rates for longer
- US GDP Q4 expected to confirm 2.9% QoQ annualized
- S&P500 fins support around 4000 level
The S&P500 futures are edging higher after four straight days of declines, with bears pausing for breath as losses so far this week sitting at over 2%.
The futures are edging higher as investors continue digesting the minutes from the February FOMC meeting, which showed that most policymakers were in favour of slowing the pace of rate hikes to 25 basis points, although there were still some policymakers supporting a 50 bps hike.
Policymakers were in agreement that interest rates need to continue rising in order to tame inflation.
While the prospect of higher rates for longer hurt sentiment at the start of the week, investors appeared to be getting accustomed to the idea of a higher terminal rate, with the USD falling lower and stocks rising.
Attention now turns to US GDP data, the second reading which is expected to confirm the preliminary reading of 2.9% growth QoQ annualized, up from 3.2%. Stronger than forecast growth could fuel hawkish Fed bets and pull stocks lower.
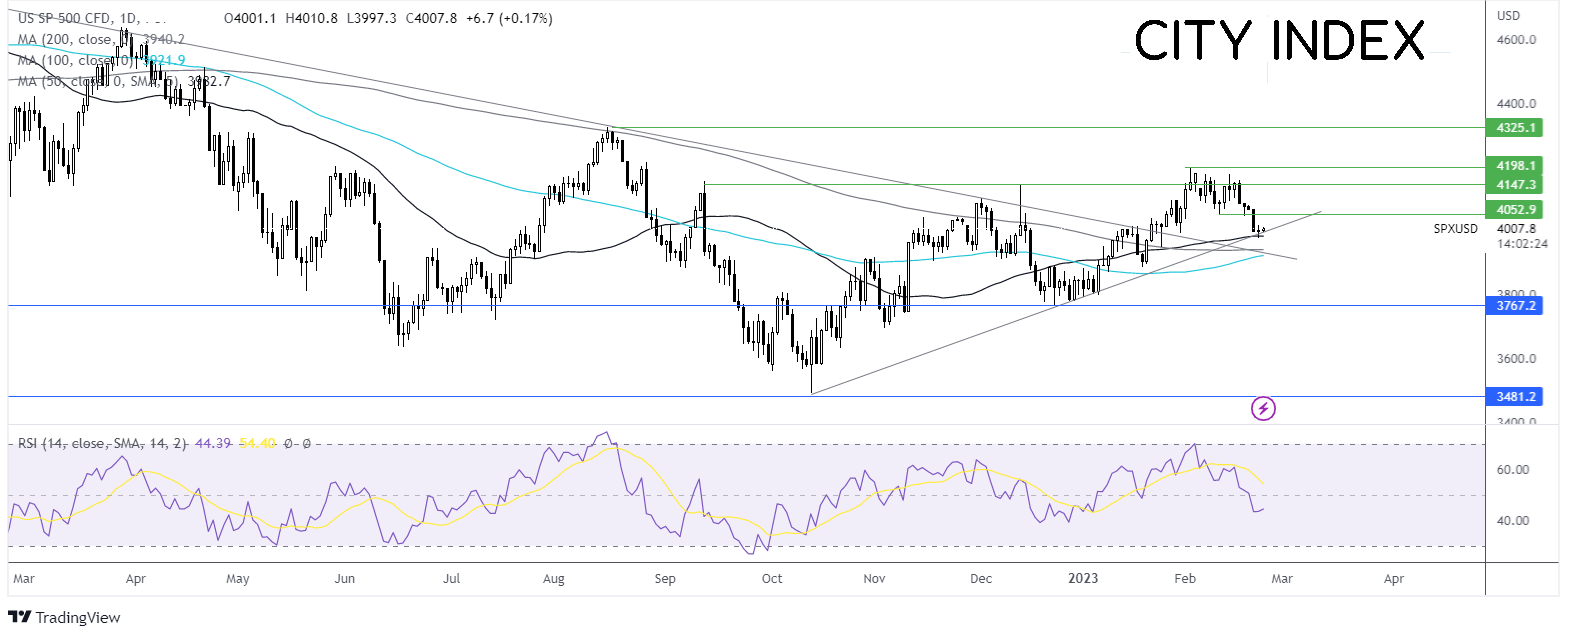
Where next for the S&P500?
The S&P500 has been trending higher since early October before running into resistance at 4195 and rebounding lower, breaking below several support levels.
The price has found support around the 4000 mark, the 50 sma, the psychological level, and the rising trendline support, so could prove a tough nut to crack.
Sellers need to break below this level to extend the bearish selloff towards 3935, the confluence of the 200 sma and the falling trendline dating back to the start of the year.
Meanwhile, should buyers defend 4000, immediate resistance can be seen at 4050, last week’s low, ahead of 4100 round number.
Latest market news
Today 08:33 AM
Latest Trade Ideas articles