


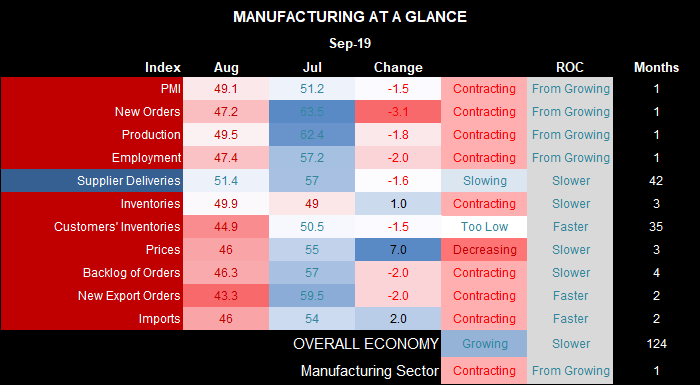
With PMI crossing below 50, calls for a recession are again on the rise. And this is no surprise, given the red flags within the internal indices.
- Of the 10 sub-indices, 9 are contracting (below 50)
- New orders are at a 7-year low (considered a leading indicator for the PMI itself)
- New export orders have nose-dived to levels not seen since 2009
- Employment is contracting at its fastest rate in over 3-years
- Production contracted for the first time in 2 years
The trade war is clearly beginning to bite. Looking through the ISM report, some respondents feeling the pinch with comments such as “slowest month this year in sales”, “business is starting to show signs of a broad slowdown” and “while business is strong, there is an undercurrent of fear and alarm regarding the trade wars and a potential recession.
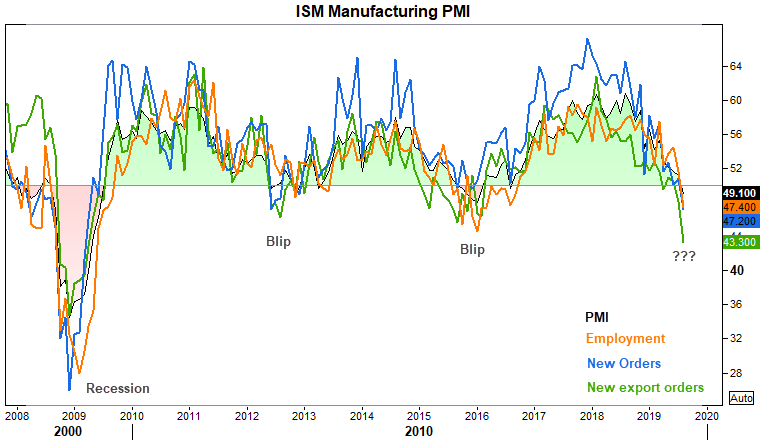
But the question now is whether this is a temporary ‘blip’ like seen in 2016 and 2012 (although headline PMI only hit 50 in 2012), or is it start of something much more severe? Time will tell, but traders are forward looking and likely adjusting portfolios to a more defensive stance.
Interestingly, the USD lost strength when the ISM crossed below 50. Whilst the data is clearly not great, it could also pile extra pressure on the Fed to ease further out; and prior analysis suggests that the USD tends to strengthen in the weeks following a cut. However, assuming the loss of USD is simply a knee-jerk reaction, we may be able to use this to our advantage.
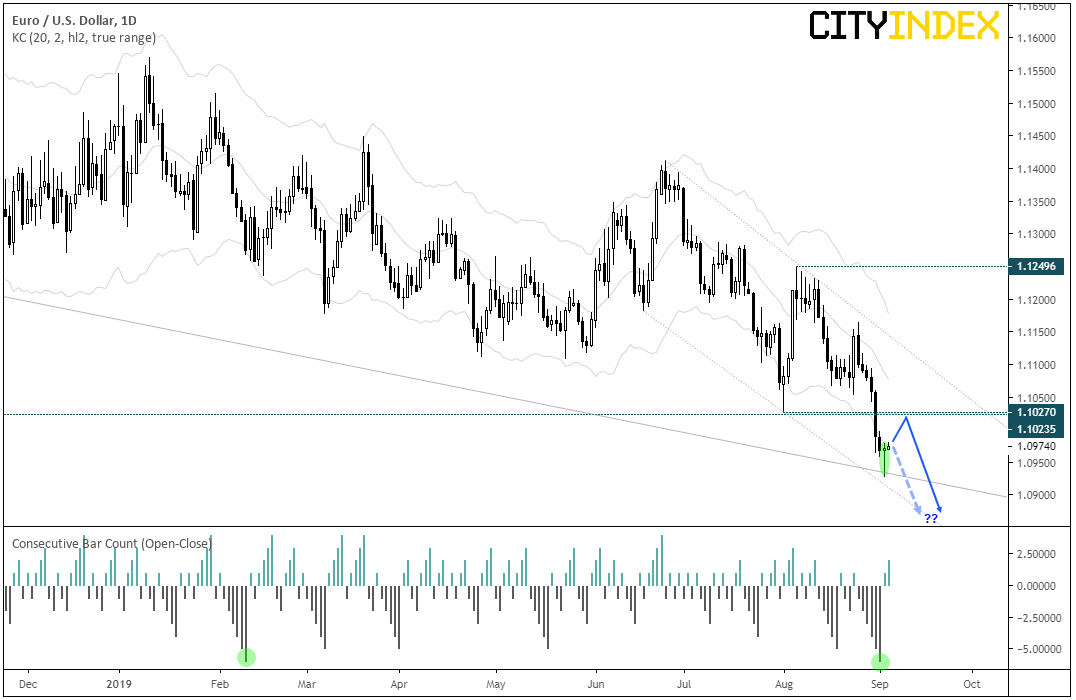
Over the near-term, we see potential for USD to strengthen and allow respective pairs to retrace. As one example, EUR/USD suggest a little mean reversion could be on the cards.
- EUR/USD has produced a bullish pinbar, and its low respected the August 2018 trendline.
- The pinbar traded beyond the lower keltner band to suggest near-term exhaustion.
- By Monday’s close, EUR/USD had seen 6 consecutive lower closes which can (but not always) preceded a correction.
If prices retrace, we’d like to see 1.10 hold as resistance before considering short setups on the daily chart. A clear break of 1.1023/27 resistance suggests a deeper correction is on the cards, although we’d then look for the bearish channel to hold.
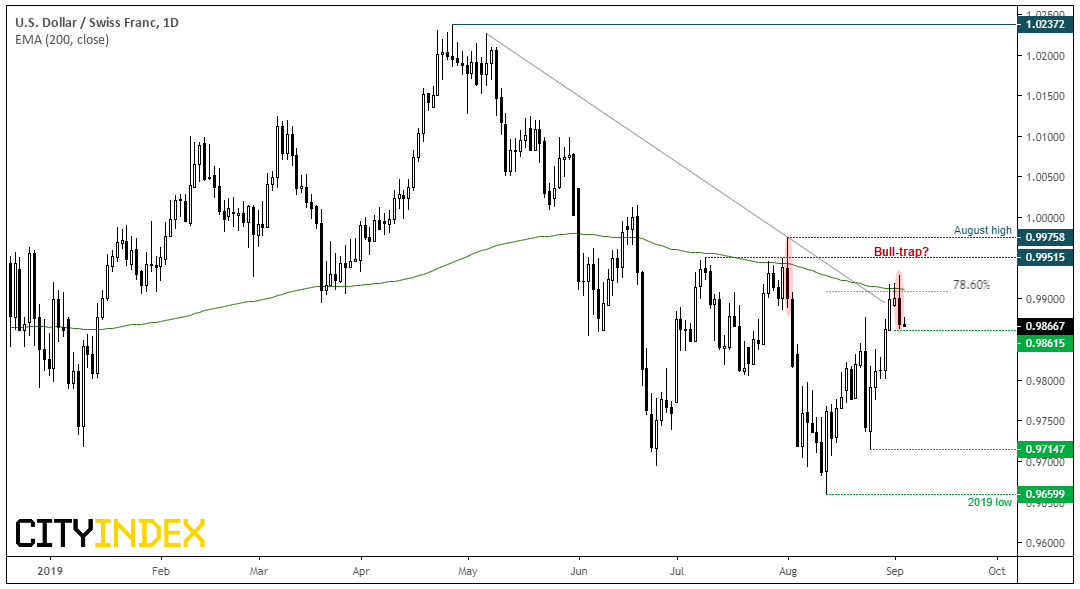
USD/CHF is also of interest. Whilst it is generally accepted EUR/USD and USD/CHF share an inverse correlation, this has not been the case since EUR/CHF established a steady downtrend, although the potential for a USD retracement also places this on the radar. Moreover, we noted USD/CHF’s tendency to trade lower throughout September, so yesterday’s bearish reversal pattern warrants close attention.
- An evening star reversal has formed near the 200-day eMA and 78.6% retracement level. A break beneath 0.9860 confirms the 3-day pattern
- The pattern occurred after failing to hold above a broken trendline, warning of a bull-trap
- Whilst price action appears erratic in places, the more volatile sessions since June have been bearish and characteristics of price action has allowed for some large swings. Interim targets include 0.98 and potentially the 0.9715 low.
Related analysis:
US ISM Manufacturing PMI Disappoints
Historically, September Has Been A Bearish Month For USD/CHF
EUR/CHF Stalls At Key Support Whilst Signs Of SNB Intervention Are Growing
Latest market news
Today 08:33 AM
Latest US articles
January 5, 2024 03:09 PM
January 4, 2024 06:55 PM
January 3, 2024 07:55 PM
January 2, 2024 08:00 PM