


May 31, 2019 1:10 AM
In the current era of big data and artificial intelligence, it's nice to know that some of the less complicated ideas and approaches to trading continue to work. In late April we wrote an article on the S&P 500 “Headwinds Increasing” in which a mix of technical and fundamental reasons were highlighted including the “sell in May and go away” phenomenon. Overall, it suggested a more cautious view of the U.S. equity market was warranted.
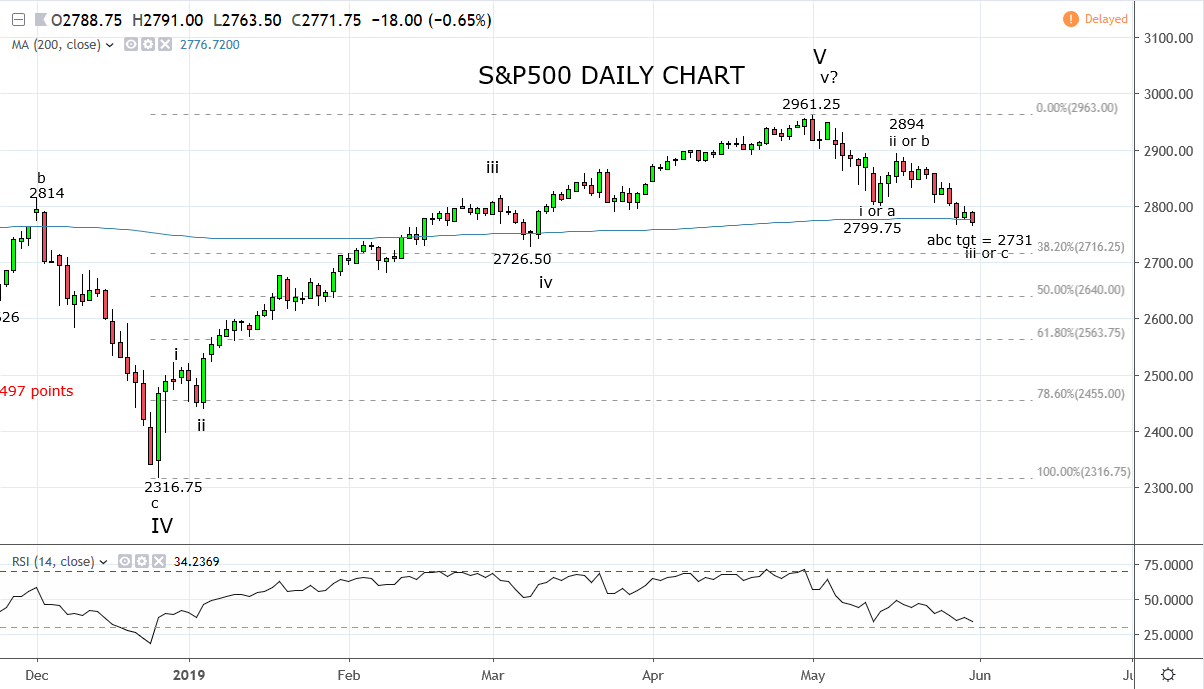
On May 2nd just one day after the S&P 500 traded to its all-time high of 2961.25, a follow-up article titled “S&P 500 buffeted” was published that highlighted the downside risks for U.S. stocks. Supporting our fundamental argument was the emergence of a “rather ugly bearish engulfing candle on the daily chart, the type often viewed before meaningful turns”.
To cement the idea that a medium-term top was in the making, the following criteria were highlighted, “a break and close below near-term support 2910, followed by a break and close below interim support 2865/55 support. Should this occur, it would project a move back to the 200-day moving average at 2770.” https://www.cityindex.com.au/market-analysis/sp-500-buffeted/.
So here we are on the final day of May. The S&P 500 is on track to record its first monthly loss in 2019, and the “sell in May” phenomena appears to have worked again. Further reinforced this morning by President Trump's announcement of tariffs on imports from Mexico unless Mexico halts “illegal migrants”.
Currently, in after-hours trading, the S&P 500 is trading right on the 2770 level, significant due to it being in the area of support provided by the closely watched 200-day moving average. Should this level break in coming sessions the next band of support is the 2730/00 region that includes wave equality (where wave a = wave c), the March 2726.50 low and the 38.2% Fibonacci retracement at 2714.
Should evidence of a base form in the 2730/00 area, it would be the catalyst for traders to consider covering all shorts and look to establish a small core long position with a view to adding on a close above 2800/20 (confirmation the correction is complete and that the uptrend has returned).
Conversely, should the S&P 500 close and accelerate below the 2730/00 support region, it would suggest a deeper pullback is underway towards the 50% fibo at 2640.
Source Tradingview. The figures stated are as of the 31th of May 2019. Past performance is not a reliable indicator of future performance. This report does not contain and is not to be taken as containing any financial product advice or financial product recommendation
Disclaimer
TECH-FX TRADING PTY LTD (ACN 617 797 645) is an Authorised Representative (001255203) of JB Alpha Ltd (ABN 76 131 376 415) which holds an Australian Financial Services Licence (AFSL no. 327075)
Trading foreign exchange, futures and CFDs on margin carries a high level of risk and may not be suitable for all investors. The high degree of leverage can work against you as well as for you. Before deciding to invest in foreign exchange, futures or CFDs you should carefully consider your investment objectives, level of experience, and risk appetite. The possibility exists that you could sustain a loss in excess of your deposited funds and therefore you should not invest money that you cannot afford to lose. You should be aware of all the risks associated with foreign exchange, futures and CFD trading, and seek advice from an independent financial advisor if you have any doubts. It is important to note that past performance is not a reliable indicator of future performance.
Any advice provided is general advice only. It is important to note that:
- The advice has been prepared without taking into account the client’s objectives, financial situation or needs.
- The client should therefore consider the appropriateness of the advice, in light of their own objectives, financial situation or needs, before following the advice.
- If the advice relates to the acquisition or possible acquisition of a particular financial product, the client should obtain a copy of, and consider, the PDS for that product before making any decision.
Latest market news
Today 11:14 AM
Today 08:28 AM
Yesterday 03:30 PM