


Sainsbury’s share slide looks set to run further this year
Sainsbury’s quarterly update has turned out largely as expected. The stock is thereby absorbing the news without much further upset on Wednesday. A key question now is whether the shares adequately reflect the impact of the supermarket’s deepening challenges a 26% decline for the year so far.
The £4.4bn group reported declines in all three product categories over three months to the end of June. That left underlying group retail sales shrinking by 1.6%, a significant deterioration vs. -0.9% in the fourth quarter and implying seasonal effects put a gloss over Q4 deceleration.
Details largely corroborate expectations of no meaningful trend improvement in the medium term.
The best that can be said about Grocery, still Sainsbury’s most consequential business, is that the 0.5% like-for-like sales contraction there was fairly stable against minus 0.6% in Q4. Even then, note good British weather flattered food retail during the quarter. It makes sense that the group’s broader outlook is tied more tightly to Grocery than the group’s other segments. As such Sainsbury’s post-Asda switch to a full-on aggressive defence mode, with 1,000 own-brand price cuts, will have an unquantified impact on margins, over the remainder of the financial year.
Nor can Sainsbury’s look to Clothing and Merchandise to offset ‘transitional’ food weakness. Both smaller categories remain in volatile retreat, despite decent indications of market share gains in clothing.
Overarching assessments of where Sainsbury’s stood by end-Q1 is objective strengthening of the Number 1 UK retailer since mid-2018. In contrast to Sainsbury’s, Tesco’s own brand-initiative has already matured. Better recognition and penetration are now reflected in double-digit growth. In turn, Tesco looks more confidently toward steady operating profit growth and stable operating margins around its 3.5-4.0% target.
It’s the relative basis that poses the biggest further downside risk to Sainsbury’s stock. After Tesco demonstrated relative stability during its own tough quarter, its shares have continued to outpace high street rivals. Yet forward expectations still peg Tesco at just 13 times 2019’s earnings. That’s below the average of UK/EU counterparts, according to Bloomberg data and less than four points above Sainsbury’s.
Even more to the point, it’s clear that the market doesn’t yet know what Sainsbury’s post-Asda Plan B is. Investors’ focus on a capital markets day scheduled in September betrays the loss of confidence in management, with signs that the group was distracted by acquisition planning. The group’s valuation gap to peers, particularly Tesco, is therefore likely to be increasingly in focus. And Tesco still looks relatively underappreciated vs. Sainsbury’s
Chart thoughts
The ‘priced-in’ case has prevailed to the extent that the shares have enjoyed a base since June’s 30-year low. It is not so much the swing itself that is questionable here, rather it’s ability to deal with formidable upside structures erected during the decline from 339p in August 2018 to 185p cycle low. Preeminent is zonal resistance between 210p and 223. The upper bound was largely unbroken support between October 2014 and last March, the lower tagged once as aggressive support after June 2016’s vote to leave the EU. Beforehand watch for a closure under the 21-day exponential average (red-dotted line) to corroborate the rolling over Stochastic oscillator. A clean declining trend line over the last year has been joined by an upper declining line to form a large wedge, and hence a possible reversal pattern. Again, TSCO’s ability to break above tightly packed resistance will be key for an optimistic interpretation.
Sainsbury’s CFD – daily
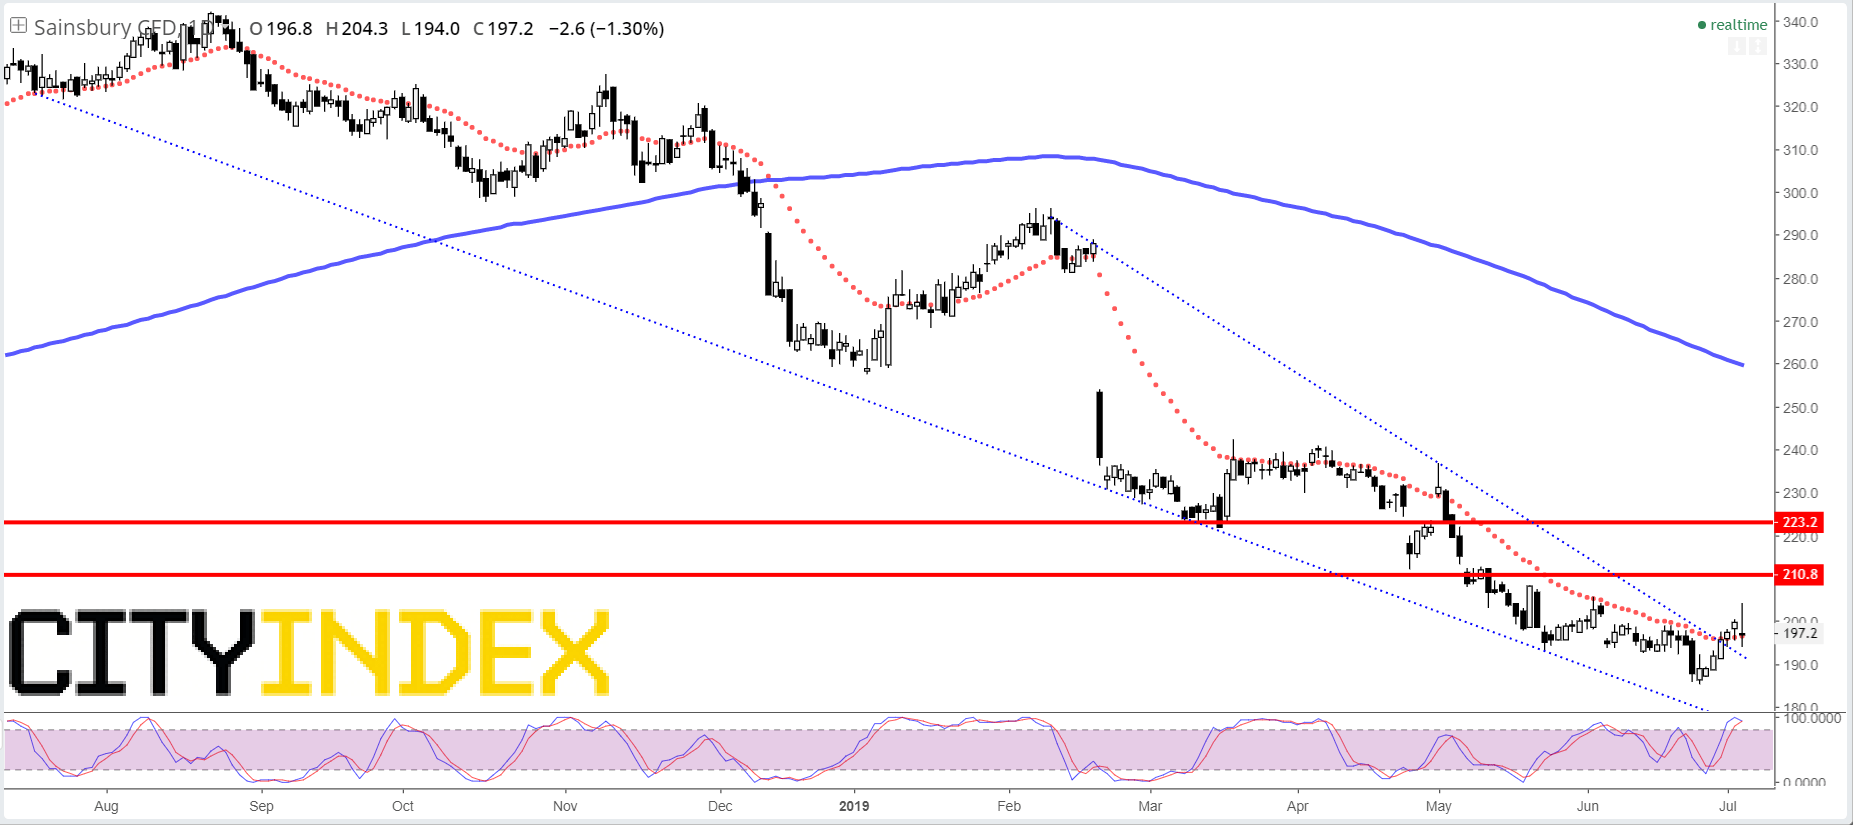
Source: City Index
Latest market news
Yesterday 08:33 AM