


August 17, 2022 4:18 PM
Can the consumer save the economy? If today’s July Retail Sales data is any gauge, it seems possible! The headline Retail Sales print for July was 0% MoM vs an expectation of +0.1% MoM and a lower revised prior reading of +0.8% MoM. However, when digging a bit deeper into the details, the headline number doesn’t seem quite so bad. When removing autos from the equation, the print was +0.4% MoM vs -0.1% MoM expected and a lower revised reading of +0.9% MoM. When removing autos and gas from the headline number, Retail Sales was much stronger than expected at +0.7% MoM vs an expectation of -0.1% MoM and +0.7% MoM in June. This shows that most of the negativity in the headline print was due to poor spending in autos and gas. Sales at non-store retailers, building materials, and electronics stores increased.
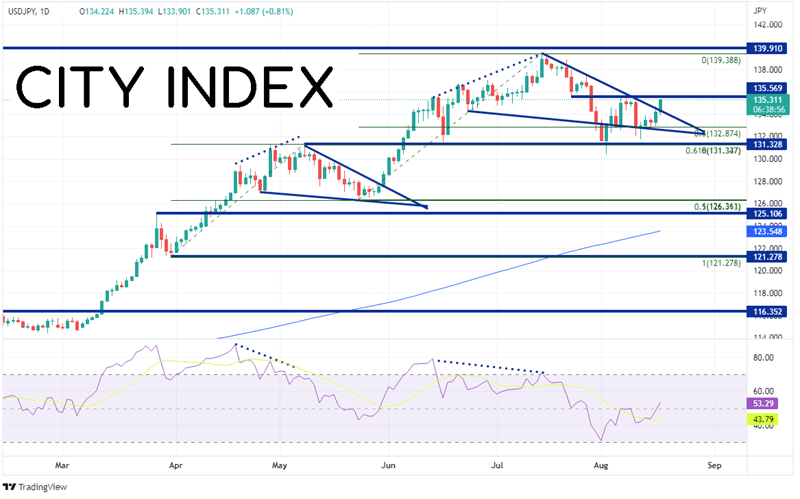
The USD/JPY has been moving higher throughout the night and continued moving in the same direction after the Retails Sales print. On a daily timeframe, the pair began moving aggressively higher on March 11th after the pair broke above horizontal resistance at 116.35. USD/JPY traded to 131.33 on May 9th, before pulling back in a descending wedge formation as the RSI was in overbought territory. The pair retraced to the 50% level from the lows of March 31st to the highs of May 9th near 126.36. Price then broke out above the top downward sloping trendline of the wedge a few days later, on March 31st. It was off to the races again for the pair, which reached its highest level since 1998 at 139.91 on July 14th. The pair then pulled back once again in a descending wedge formation as the RSI was in overbought territory. This time, USD/JPY pulled back to the 61.8% Fibonacci retracement level (as opposed to the 50% retracement level in the first descending wedge) and posted a false breakdown below the bottom trendline of the wedge. The pair moved back into the wedge, and today, broke out above the top downward sloping trendline. Could the pair be off to the races once again?
Source: Tradingview. Stone X
Trade USD/JPY now: Login or Open a new account!
• Open an account in the UK
• Open an account in Australia
• Open an account in Singapore
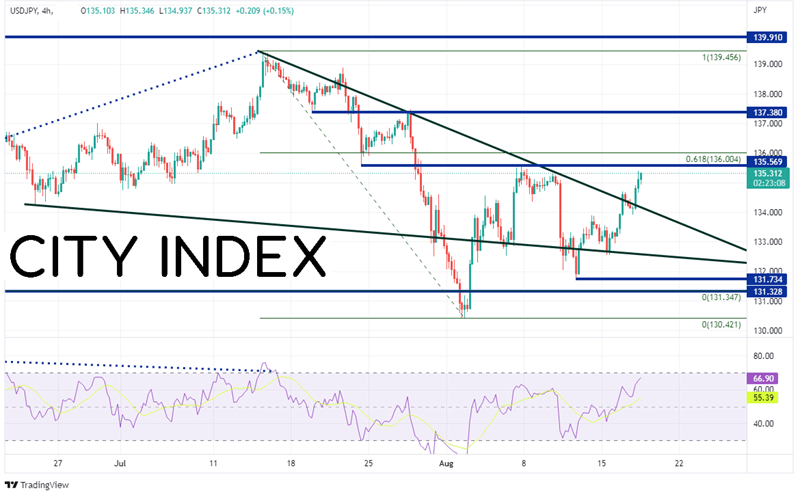
On a 240-minute timeframe, if the USD/JPY is to continue to move higher, it must first pass through horizontal resistance at 135.57. Just above there is the 61.8% Fibonacci retracement level from the July 14th highs to the August 2nd lows near 136.00. The next level of horizontal resistance below the July 14th highs is at 137.38. If the near-term resistance holds, the first support level is at the top downward sloping trendline of the wedge and today’s lows at 133.90. Below there, the next support level is the bottom trendline of the wedge near 132.56, then the August 11th lows at 132.71.
Source: Tradingview. Stone X
The July headline Retail Sales print was slightly weaker; however, the core print was stronger. Due to the mixed data, USD/JPY continued its overnight path higher as price broke out of a descending wedge. Are new 24-year highs ahead? With high inflation and negative US growth, it may depend on the ability of the consumer to hold up the economy!
Learn more about forex trading opportunities.


