


October 27, 2022 5:04 PM
After two quarters in a row of negative GDP (which is considered a technical recession), the first look at the third quarter print shows that the US has rebounded out of the recession and is now back in positive territory. The Q3 reading was 2.6% vs an expectation of 2.4% and a Q2 reading of -0.6%. The largest factor contributing to the increase was tightening of the trade gap, as imports fell 6.9% while exports jumped 14.4%. In addition, the GDP Price Index was 4.1% for Q3 vs an expectation of 5.3% and a Q2 reading of 9.1%! Perhaps the Fed’s rate hikes are beginning to work?
The Q3 GDP was better than expected despite the worse than expected durable goods orders for September. The MoM print was 0.4% vs an expectation of 0.6% and an August reading of 0.2%. However, the Non-Defense Goods orders, (ex-Air) was -0.7% vs 0.5% expected and 0.8% in August. In addition, ex-transportation, the reading was -0.5% vs 0.2% expected and 0% in August. This means that a majority of the Durable Goods orders were made up of transportation, in particular, government orders for aircraft.
As the Fed is extremely focused on Core PCE, it should be noted that the Q3 Advanced look at the inflation indicator was 4.5% vs an expectation of 4.5% and a previous reading of 4.7%. This was the lowest reading since Q2 2021. As this print was in-line, and includes September data, if may be inferred that Friday’s Core PCE reading for September should also be near expectations at 5.2% YoY.
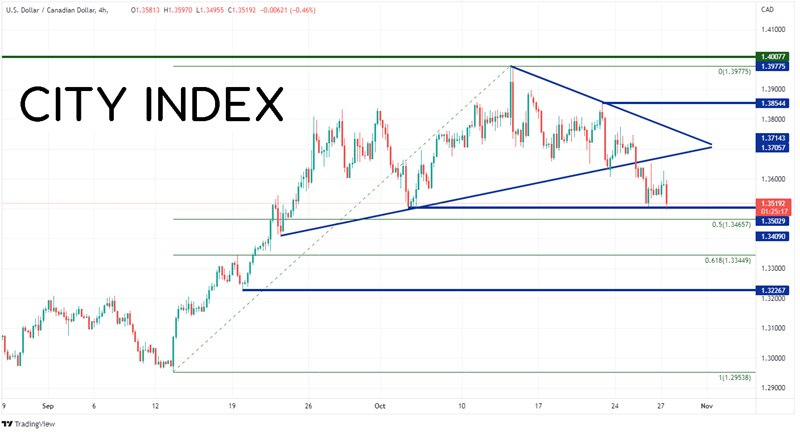
USD/CAD made a near-term high print at 1.3978 on October 13th. Since then, the pair has been moving aggressively lower as the US Dollar has been plunging. Today’s mixed data didn’t help USD/CAD much either, as signs of a weakening economy and high inflation are weighing on the US Dollar. The pair is currently trading near a confluence of support at near the lows of October 4th and the top, upward sloping trendline of the long-term channel the pair had been in since until September 21st, near 1.3502.
Source: Tradingview, Stone X
Trade USD/CAD now: Login or Open a new account!
• Open an account in the UK
• Open an account in Australia
• Open an account in Singapore
If USD/CAD continues to move lower through 1.3502, the first level of support is at the 50% retracement from the lows of September 12th to the highs of October 13th at 1.3466. Below there, the next support level is at the 61.8% Fibonacci retracement from the same timeframe, then the lows of September 22nd at 1.3227. However, if the support holds and USD/CAD bounces, the first resistance level is the bottom line of the symmetrical triangle near 1.3670, then the top line of the triangle near 1.3780. If price breaks above there, the next resistance is the highs from October 21st at 1.3855.
Source: Tradingview, Stone X
Today’s US data did little to help traders change theirs minds regarding the possibility of a 75bps hike at next week’s FOMC meeting. The GDP data beat expectations, however, it is old data. The same can be said for the Q3 Advanced look at Core PCE. The Durable Goods headline data was good, but the details weren’t as good. Today, the data shows unchanged expectations heading into next week’s FOMC meeting.
Learn more about forex trading opportunities.
Latest market news
Today 11:14 AM
Today 08:28 AM
Yesterday 03:30 PM
Latest Trade Ideas articles

Today 11:14 AM
Yesterday 11:00 AM
Yesterday 08:15 AM