
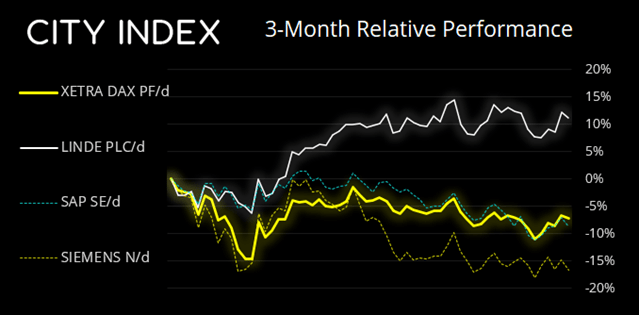


Initial impressions of the market internals for the DAX are a little underwhelming. Only 5 of its 40 stocks have posted a gain year to date, one of which is by a mere 0.25% (MTU Auto Engines). Furthermore, 4 of its top 5 stocks by market cap are in the red this year, which is not great new for a market cap weighted index.
However, a quick look at Linde (LINI.DE) – which has a ~10% weighting within the DAX – remains supported above 280 and trades just -5.6% below its record high. Its second largest stock (SAP) found support above its 2020 low, whilst Siemens (its third largest) put in a strong low around 110 last week and could be part of a basing pattern. So whilst the stats aren't overwhelmingly bullish for the DAX, there are hints that key stocks have found support and could be headed for another leg higher.
DAX 30 trading guide
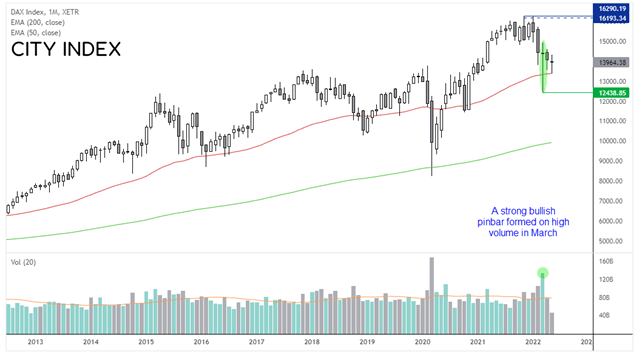
DAX monthly chart:
We believe the DAX is currently retracing against its rally from the March low. The monthly chart shows a strong pinbar on high volume mark support at 12,438.85 and prices have since drifted back and found support at the 50-month eMA. The current month’s candle is yet to close but, at current levels, is on track for a Doji on low volume. Volume was also lower in April whilst prices declines which suggests it is corrective.
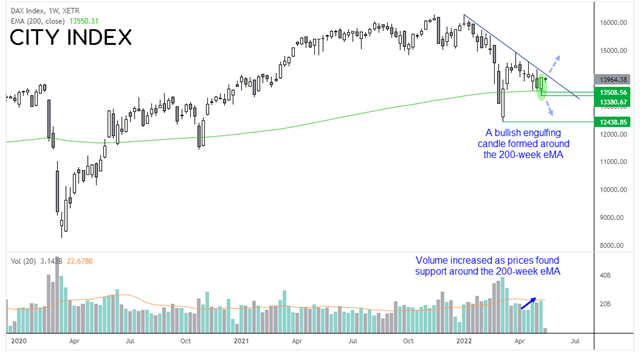
DAX weekly chart:
The weekly chart shows that a bullish engulfing (and outside) candle formed last week at the 200-week eMA. Also note that volumes increased as prices found support around 13,380. Should prices hold above last week’s low then we’re seeking a break of its retracement line, which is projected from its record high around 16k.
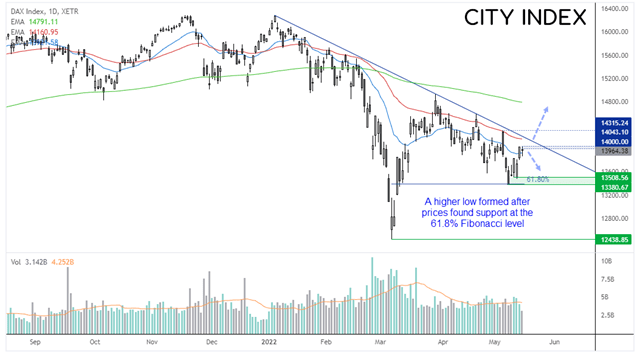
DAX Daily Chart:
The daily chart is on the choppy side, but that is also a characteristic of a retracement. Note how last week’s low almost perfectly respected the 61.8% Fibonacci ratio, and has since seen a higher low around 13,500.
Prices are consolidating around 14k ad currently remains unclear as to whether it is ready to break trend resistance or recycle lower once more. A reversal candle below or around trend resistance (and the 50-day eMA) would tempt us into a bearish swing trade over the near-term, where we’d then seek evidence of another higher low above 13,500. A break above the trendline (preferably on high volume) can be used as a change of trend waning, or traders could wait for a break or daily close above the 14,315 high for extra confirmation.
How to trade with City Index
You can easily trade with City Index by using these four easy steps:
-
Open an account, or log in if you’re already a customer
• Open an account in the UK
• Open an account in Australia
• Open an account in Singapore
- Search for the company you want to trade in our award-winning platform
- Choose your position and size, and your stop and limit levels
- Place the trade
How to trade with City Index
You can easily trade with City Index by using these four easy steps:
- Open an account, or log in if you’re already a customer
- Search for the company you want to trade in our award-winning platform
- Choose your position and size, and your stop and limit levels
- Place the trade
Latest market news
Yesterday 01:23 PM
Yesterday 06:01 AM
April 18, 2024 11:27 PM
April 18, 2024 04:46 PM
Latest Indices articles
April 18, 2024 04:46 PM
April 17, 2024 11:00 AM
April 16, 2024 08:00 PM
April 16, 2024 04:54 PM