


July 26, 2022 4:34 PM
Earlier today, EU member states agreed to voluntarily cut their use of Russian gas by 15% as fears increase that Russia may shut off gas flow completely heading into the European winter months. This was despite earlier protests by some Eurozone countries that don’t rely on Russia gas as much as others, such as Spain and Portugal. However, in the end, the proposal was agreed. On Monday, Gazprom announced that it would be halving the amount of gas supply to Europe, from 40% capacity to 20% capacity due to equipment repairs. However, many believe this may just be another tactic used by Russia as political leverage due to the war in Ukraine. Ukrainian President Zelensky went as far as to call the move by Russia “gas blackmail”.
What is Natural Gas and how do you trade it?
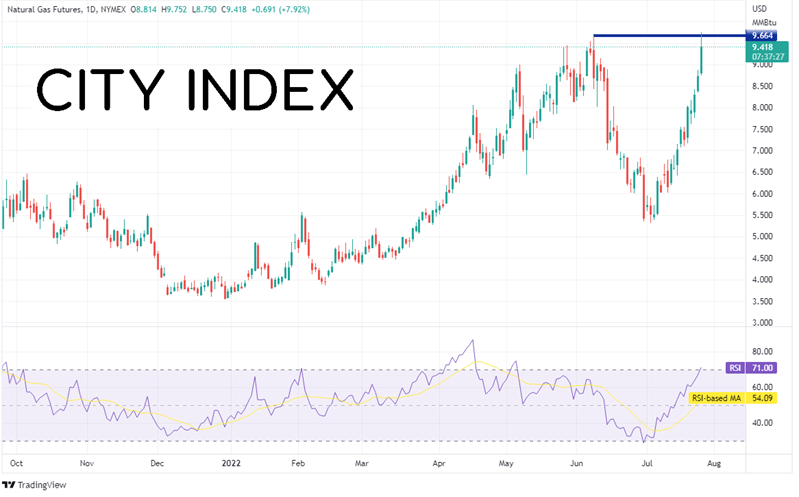
US Natural Gas Futures traded on the NYMEX made 14-year highs today as mounting fears sent prices soaring. Natural Gas briefly took out the highs from June 8th, reaching an intra-day high of 9.752.
Source: Tradingview, NYMEX
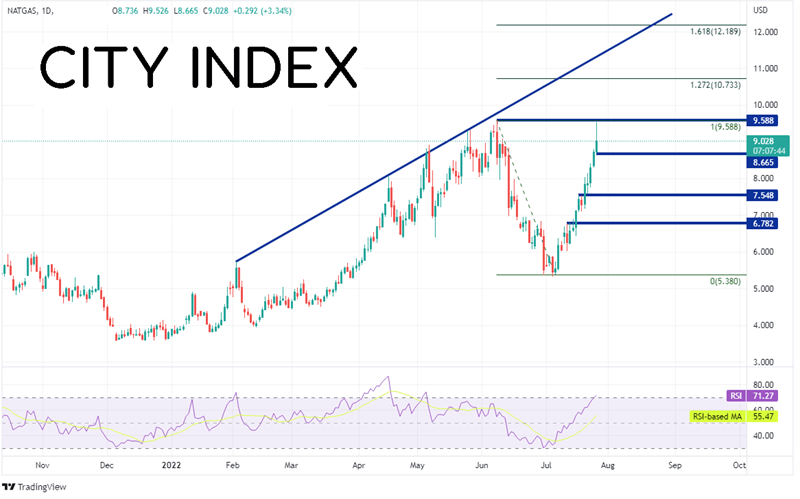
Thus far today, spot market natural gas has come up just short of the 14-year high, reaching a high of 9.526 vs the June 8th highs of 9.588. Resistance above the June 8th highs cross at the 127.2% Fibonacci extension from the highs on June 8th to the lows of July 6th, near 10.733. Above there, trendline resistance dating to February 2nd crosses near 11.345 and then the 161.8% Fibonacci extension from the previously mentioned timeframe near 12.189. First support crosses at today’s low near 8.665. Below there, price can fall to horizontal support at 7.548 and 6.782. Note that we can’t draw Fibonacci levels yet, as we don’t know if today is the high of the move.
Source: Tradingview, Stone X
Trade Natural Gas now: Login or Open a new account!
• Open an account in the UK
• Open an account in Australia
• Open an account in Singapore
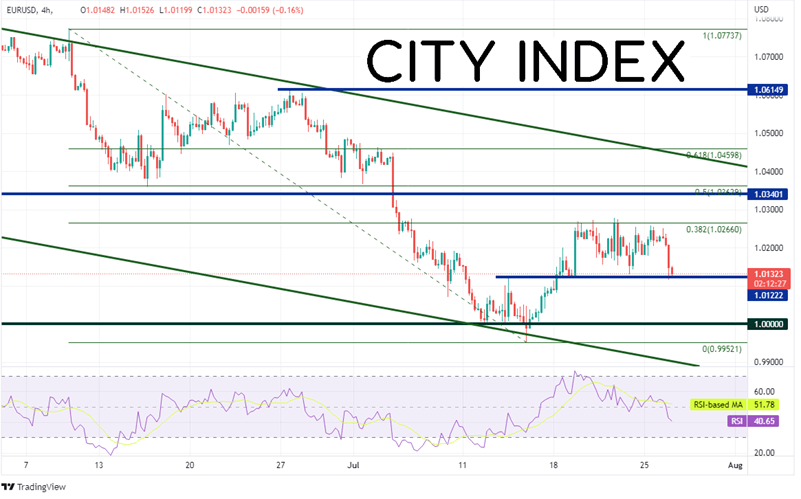
The scare in gas prices is having a knock-on effect on EUR/USD. The pair was down over 100 pips intra-day. EUR/USD has been confined to a range between 1.0127 and 1.0278 since July 18th as markets wait for tomorrow’s FOMC decision. However, the pair is threatening the bottom level today as fears of winter gas supply weigh on the Euro. If price fall below 1.0127, the next level of support isn’t until the lows of July 14th at 0.9952, then the bottom trendline of a long-term downward sloping channel near 0.9900. First resistance is at the highs from July 21st at 1.0278, then a strong previous support level (now resistance) near 1.0340/1.0350. Just above there is the 50% retracement level from the highs of June 9th to the lows of July 14th at 1.0364.
Source: Tradingview, Stone X
Trade EUR/USD now: Login or Open a new account!
• Open an account in the UK
• Open an account in Australia
• Open an account in Singapore
Natural gas prices have been on the rise. If Russia continues to harass Europe by threatening to shut off gas flows, the commodity could move much higher. However, if Europe is able to secure enough gas for the winter, prices should move lower. Watch for knock-on effects in the Euro as jitters may send EUR/USD lower.
Learn more about commodity trading opportunities.
Latest market news
Today 11:14 AM
Today 08:28 AM
Yesterday 03:30 PM
Latest Trade Ideas articles

Today 11:14 AM
Yesterday 11:00 AM
Yesterday 08:15 AM