


JP Moragan Chase (JPM)
click to enlarge charts
Key elements
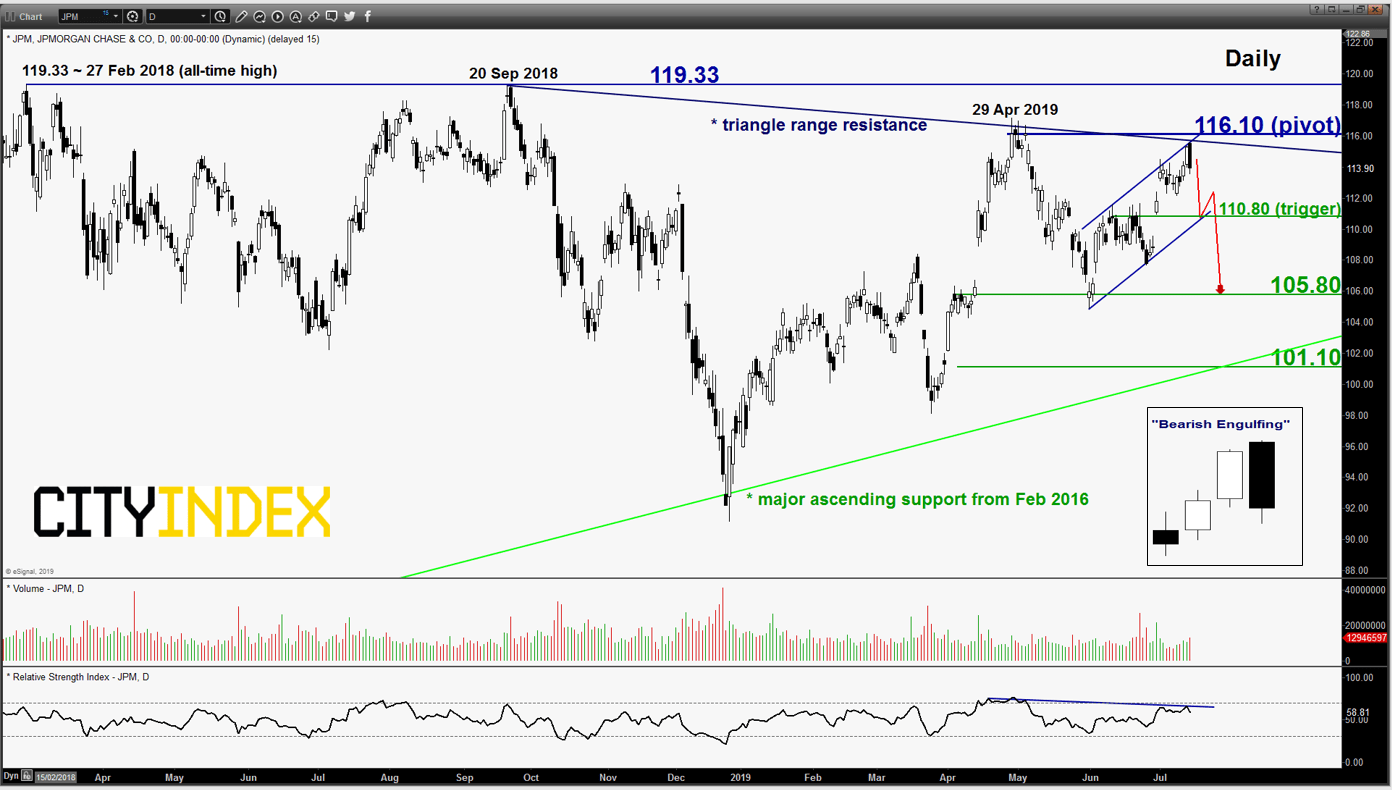
- The recent 10% up move of JPM share price from its 31 May 2019 low has tested the medium-term “triangle range” resistance in place since 20 Sep 2018 where it has tested and failed to break above its current all-time high level of 119.33 printed on 27 Feb 2018.
- JPM has declined by -1.77%; that underperformed the Financials sector (-0.57%) which was the 2nd worst performer among the S&P sectors in yesterday, 15 Jul U.S. session.
- The price action of JPM has formed a daily “Bearish Engulfing” pattern at end of yesterday’s U.S. session right at the aforementioned “triangle range” resistance.
- Near-term support rests at 110.80 which is defined by a minor “ascending range” support in place since 31 May 2019 low.
- Key medium-term resistance stands at 116.10 as per defined a Fibonacci projection cluster and close to the medium-term “triangle range” resistance.
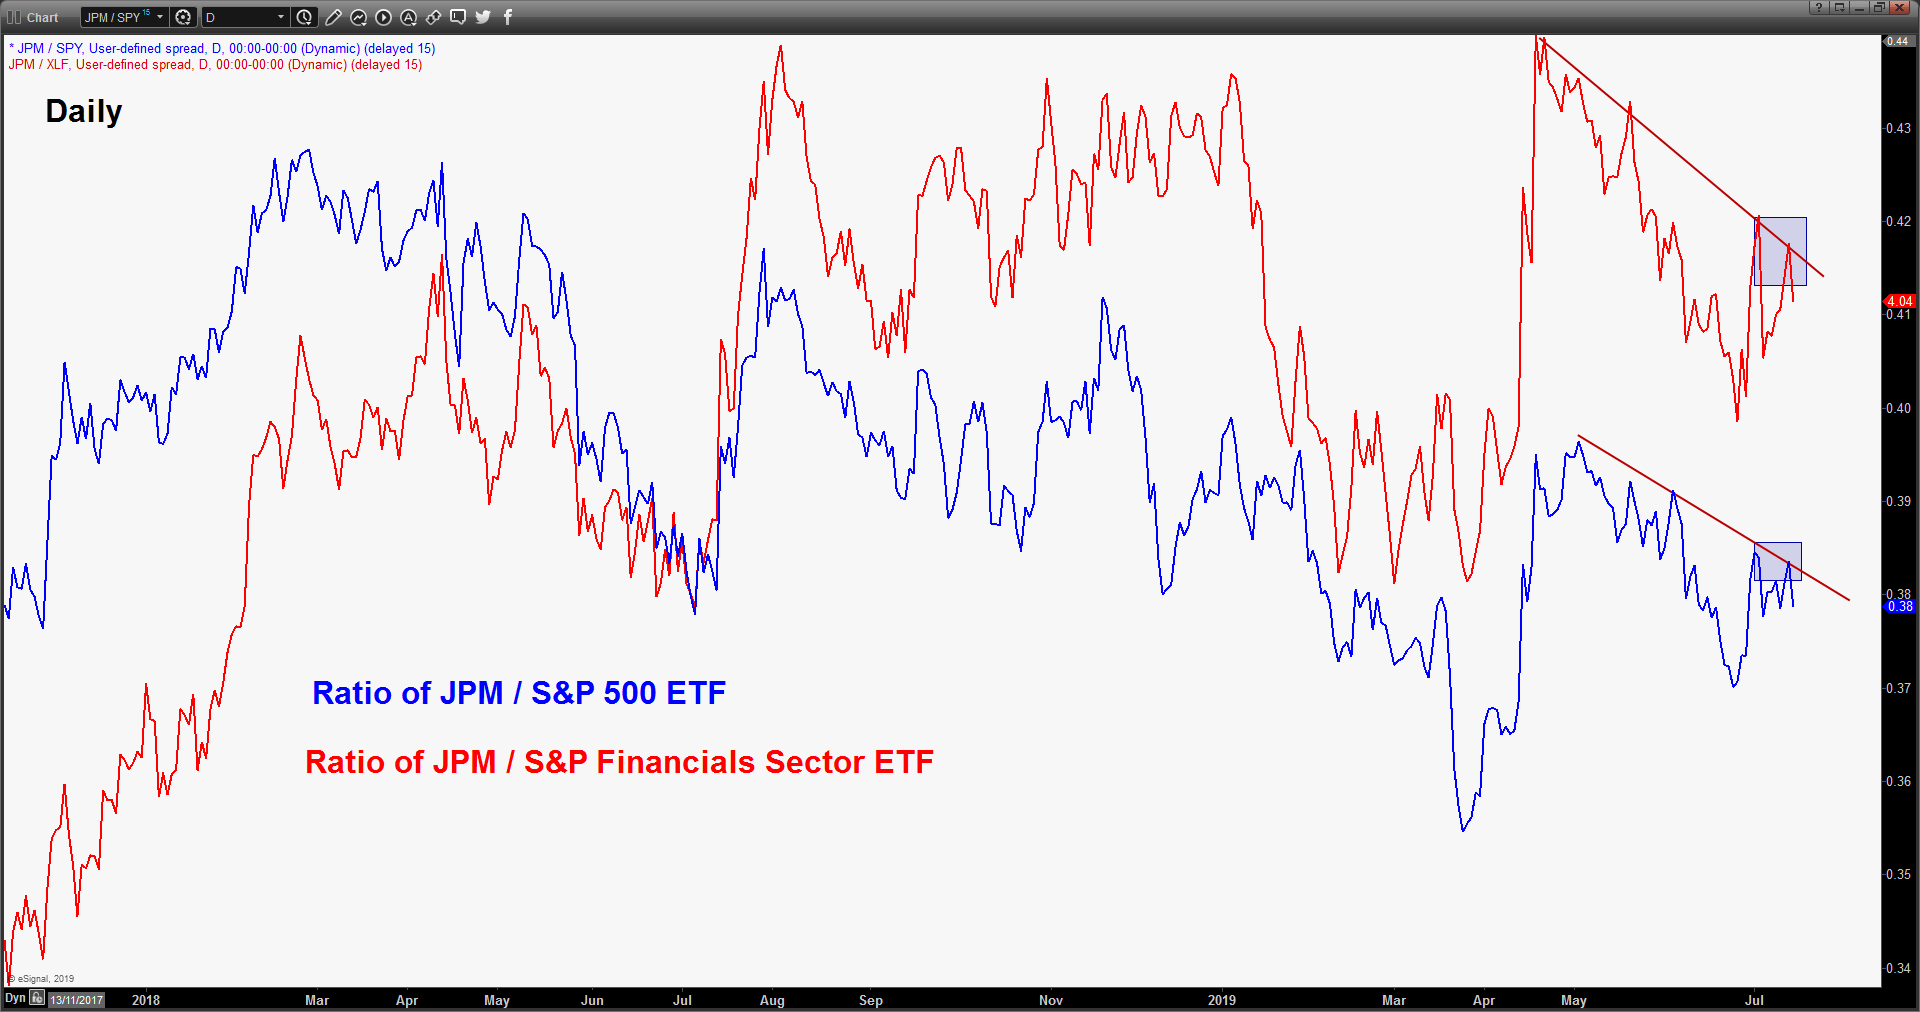
- Relative strength analysis from the ratios of JPM against its industry sector (S&P Financials XLF) and the U.S. benchmark stock index (S&P 500) have continued to exhibit medium-term weakness/underperformance.
Key Levels (1 to 3 weeks)
Pivot (key resistance): 116.10
Supports: 110.80 & 105.80
Next resistance: 119.33
Conclusion
If the 116.10 pivotal resistance is not surpassed and a break with a daily close below 110.80 is likely to see a further potential push down to target the next support at 105.80.
On the other hand, a clearance with a daily close above 116.10 sees a squeeze up to retest the all-time high of 119.33.
Charts are from eSignal
Latest market news
Today 08:15 AM
Latest Shares market articles
November 2, 2023 01:41 PM
November 1, 2023 01:33 PM
October 31, 2023 01:15 PM
October 31, 2023 10:24 AM