


July 28, 2022 7:59 PM
In a few hours, Japan will release a plethora of data for June, including Industrial Production, Retail Sales, and the Unemployment Rate. All are expected to be slightly better than the May data. In addition, Japan will release Tokyo CPI for July. This is often used as a proxy for overall inflation as so much of it makes up Japan’s CPI print. This is also expected to be slightly higher than the June reading of 2.3%. If the data dump today comes out as expected, will the BOJ turn less dovish? It's unlikely. At the July BOJ meeting on July 21st, the central bank left rates at -0.1%, said that it would continue to buy as many 10-year JGBs as necessary to keep yields below 0.25%, and continue with its YCC program. And although the Committee raised its 2022 inflation forecast to 2.5% from 1.9%, the BOJ reiterated that would not hesitate to take extra easing measures if needed. In addition, earlier today BOJ Deputy Governor Amamiya said “we must not loosen our grip in keeping policy easy as there is not prospect yet of sustainably meeting the 2% inflation target”!
Everything you need to know about the Bank of Japan
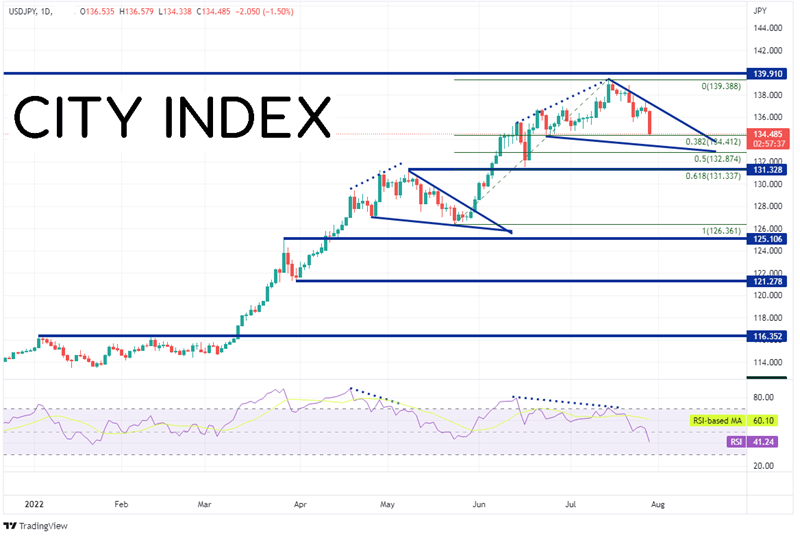
USD/JPY began trading aggressively on March 11th, when price broke above 116.35. The pair moved to a high of 131.35 on May 9th and then pulled back in a corrective, descending wedge as the diverging RSI moved from overbought back to neutral territory. USD/JPY broke out of the descending wedge on May 31st, near 127.51, and resumed its move higher. The pair went on to trade at its highest level since September 1998 at 139.39. Notice that at the time, the RSI was overbought and diverging with price. Since then, USD/JPY has been moving lower as the RSI moved back into neutral territory. Could price be forming another descending wedge? Notice on the first wedge how price pulled back to the 50% retracement level from the lows of March 31st to the highs of May 9th.
Source: Tradingview, Stone X
Trade USD/JPY now: Login or Open a new account!
• Open an account in the UK
• Open an account in Australia
• Open an account in Singapore
On a 240-minute timeframe, USD/JPY began moving lower from the July 14th highs at 139.39 in a descending wedge formation. Thus far, the pair has pulled back to the 38.2% Fibonacci retracement level from the lows of May 24th to the highs of July 14th, near 134.41. If price is to follow a similar pattern as the first descending wedge and trade down to the 50% retracement level, it would target 132.87. That now acts as the first level support. Below there, USD/JPY could fall to the 61.8% Fibonacci level from the same timeframe at 131.33. Notice that the RSI on the 240-minute timeframe is oversold, indicating the pair may be ready for a bounce. If the pair moves higher, first resistance is at the lows from July 22nd at 135.57. Above there is the downward sloping trendline of the wedge near 137.20 and then the recent highs at 139.39.
Source: Tradingview, Stone X
USD/JPY has been moving lower over the last couple of weeks. However, this probably has more to do with falling US yields than the strength of the Yen. The BOJ recently stated that it will take extra easing measures if necessary. Will stronger economic data due out from Japan shortly help the Yen continue to strengthen? It seems unlikely as USD/JPY is moving based more on the US Dollar rather than the JPY. But, if the pair reaches support at the 50% retracement level near 132.87 as it did in the previous descending wedge, watch for the pair to bounce!
Learn more about forex trading opportunities.
Latest market news
Yesterday 01:23 PM
Yesterday 06:01 AM
April 18, 2024 11:27 PM
April 18, 2024 04:46 PM
Latest Trade Ideas articles

April 18, 2024 11:27 PM
April 18, 2024 04:46 PM