


January 30, 2020 3:59 PM
It may be Time for USD/CAD to Pullback
After the Bank of Canada meeting on January 23rd, USD/CAD took off higher and hasn’t looked back. Although the BOC kept rates unchanged, they were one of the final major central banks to move from a neutral to a dovish stance. Heading into December 2019, much of the data from Canada had been worse than expected. However, the data released in January hasn’t been as bad. Employment data beat solidly and Retail Sales, although for November, were much stronger than expected. Still, with the Central Bank citing global uncertainties as one of the main issues for their dovishness, markets have been pushing USD/CAD higher.
As we have discussed previously, USD/CAD had been in a symmetrical triangle since early 2018 and in December 2019, the pair broke lower below the rising trendline near 1.3150. USD/CAD proceeded lower to near 1.2950 on December 31st. Since then, the pair has moved over 250 pips and is currently testing the bottom trendline of the triangle and the 200 Day Moving Average near 1.3230.
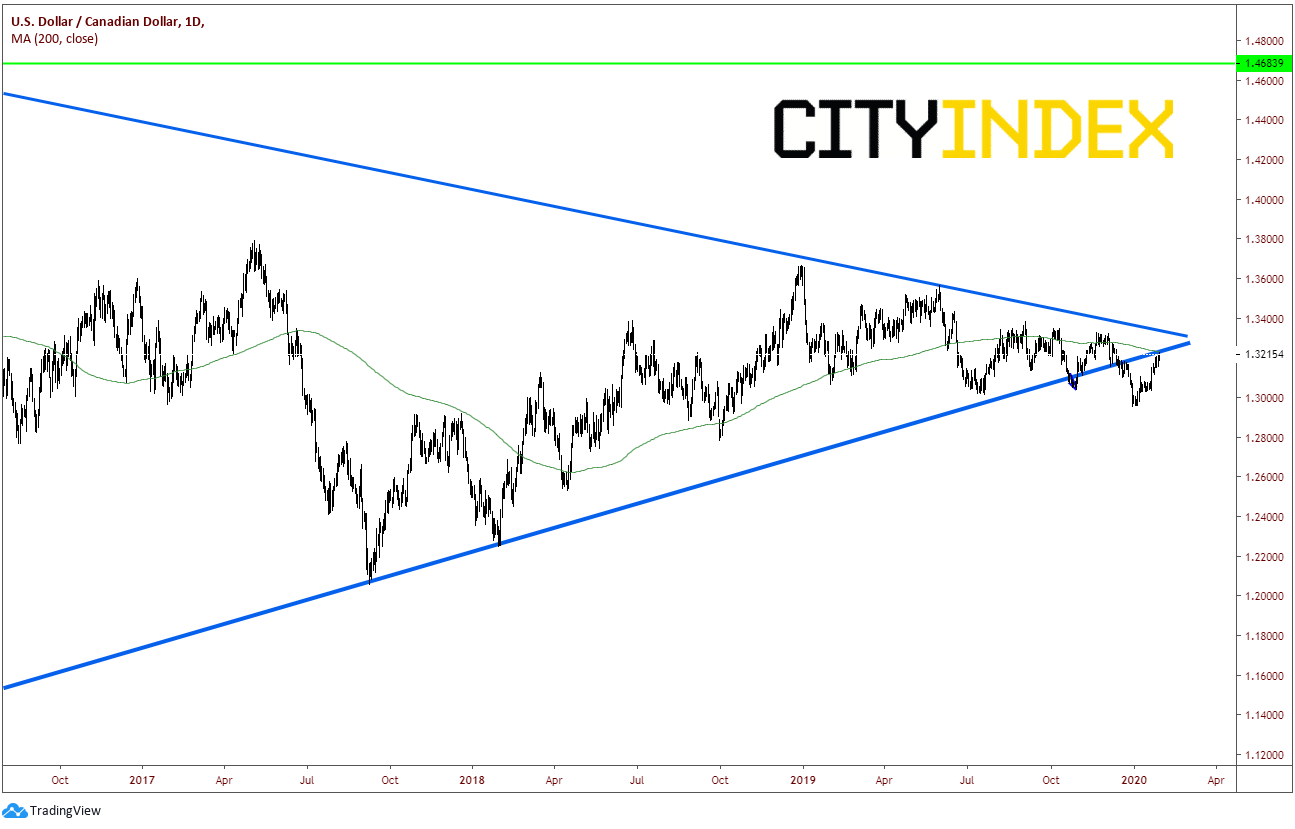
Source: Tradingview, City Index
On a 240-minute timeframe, we can see how USD/CAD traded off the December 31st low and was halted at the 38.2% Fibonacci retracement level of the November 20th high to the December 31st lows near 1.3100. However, the dovish BOC was enough to push the higher and it has been moving higher since. USD/CAD is currently stalled at horizontal resistance near 1.3225 and has formed a rising wedge. If price breaks lower, the target from the rising wedge is a 100% retracement of the wedge, which is near 1.3150. The RSI is also diverging from price, which also indicates a pullback may be ahead.
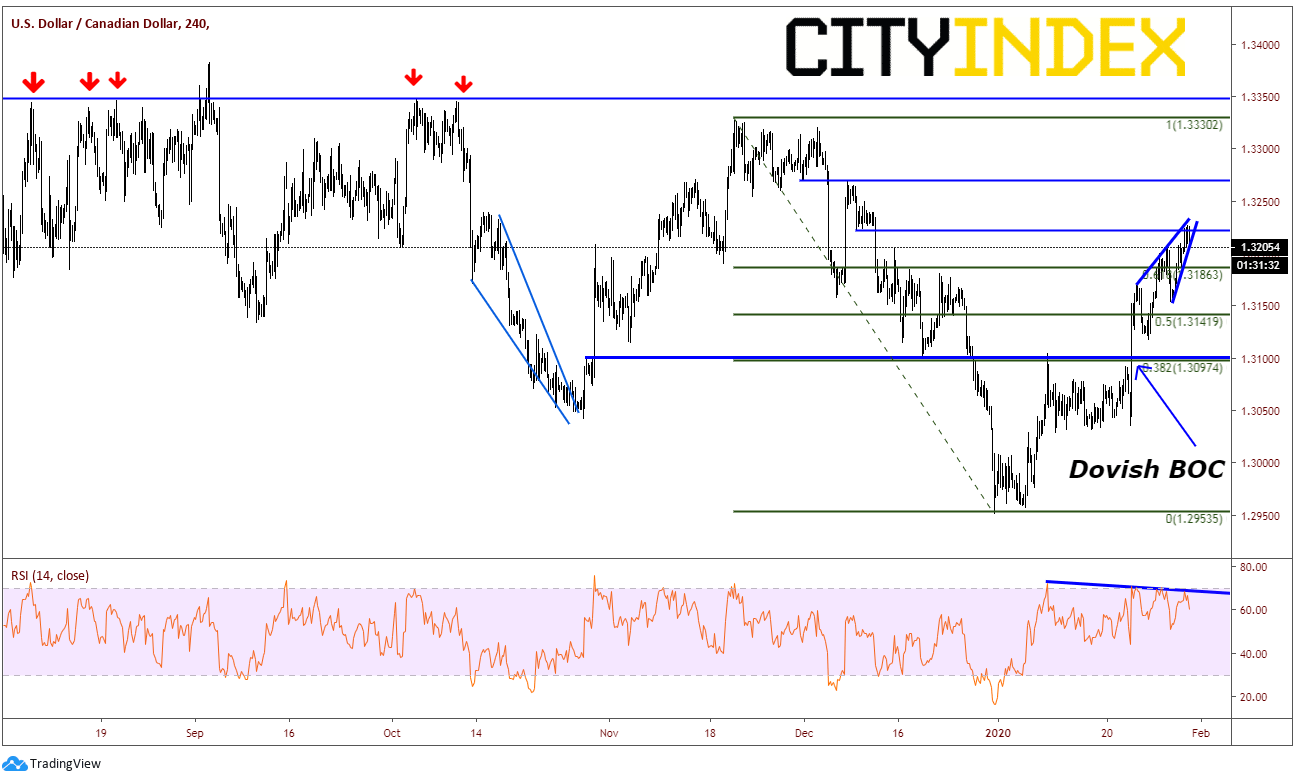
Source: Tradingview, City Index
If price can break above 1.3225, there is some horizontal resistance near 1.3270 where price may pause, however there is little in the way from stopping it until the November 20th highs near 1.3330. This level also coincides with the upper trendline of the downward sloping trendline on the daily chart. There is also a series of prior highs near 1.3350. First support is the rising trendline from the wedge at 1.3200. Below that, there are a few minor levels of horizontal support, however USD/CAD can fall back to the horizontal resistance and 38.2% retracement previously mentioned near 1.3100.
Tomorrow, Canada releases November GDP and PPI data for December. The expectation for November GDP MoM is 0.1% vs -0.1% last. Expectations for December’s PPI MoM is 0% vs 0.1% last. Its hard to tell how price will react to the data. On one hand, if they are both worse USD/CAD may go bid, as there will be more expectations of a rate cut at the next BOC meeting on March 4th. If the data is better, perhaps USD/CAD trades lower on less of a chance of a cut. Regardless, one should always use proper risk/reward, especially around economic data.
Latest market news
Yesterday 01:23 PM
Yesterday 06:01 AM
April 18, 2024 11:27 PM
Latest Dollar articles
April 18, 2024 06:20 AM
February 16, 2024 11:30 AM
February 7, 2024 03:30 PM
February 2, 2024 02:00 PM