


February 24, 2022 9:17 PM
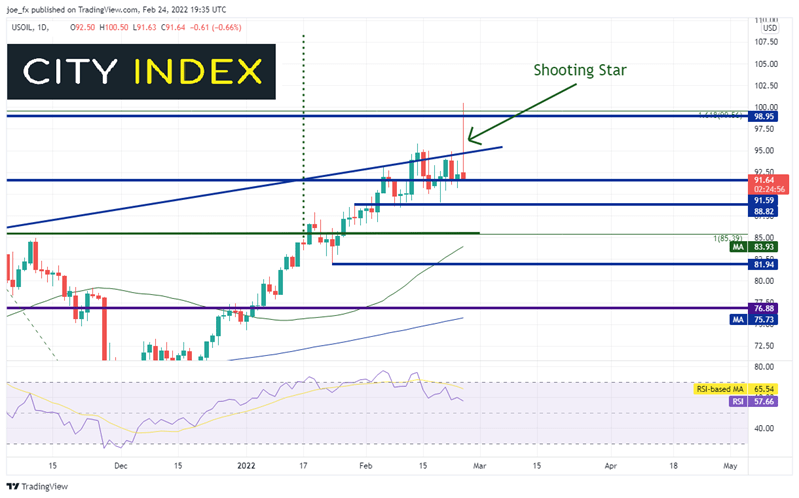
With the full-scale Russian invasion into Ukraine, WTI Crude oil reached a high of 100.50, its highest level since 2014. At its peak today, the price of oil was up over 8.5%. Price has since cooled off, closing up only 0.35% on the day. But that doesn’t mean price won’t remain high and possibly even take out the 100.50 level. After all, Russia provides Europe with 35% of its oil needs. Sanctions have been placed on Russia; however, it seems for the moment, none of them will affect energy. Therefore, the price action in today’s daily candlestick was a “Buy the rumor, sell the fact”, as traders waited for the sanctions on Russia’s energy to Europe. When those sanctions didn’t come, price sold off.
Also note that an agreement may soon be reached with Iran, which would allow them to supply oil to the market once again. If a deal is reached, Iran could be on-line with 1 million bpd once they ramp up production. The increase in supply could come at just the right time if the West decides to cut off oil supply from Russia.
Who are the world’s largest oil producers?
When we see the “Buy the rumor, sell the fact” trade in a daily candlestick form, it is called a “Shooting Star”, which is a one-candle reversal pattern. The day opens near the lows, trades to new highs, then reverses and closes near the opening price. A shooting star is an indication that price may continue to move lower the following day.
Source: Tradingview, Stone X
Japanese candlestick cheat sheet
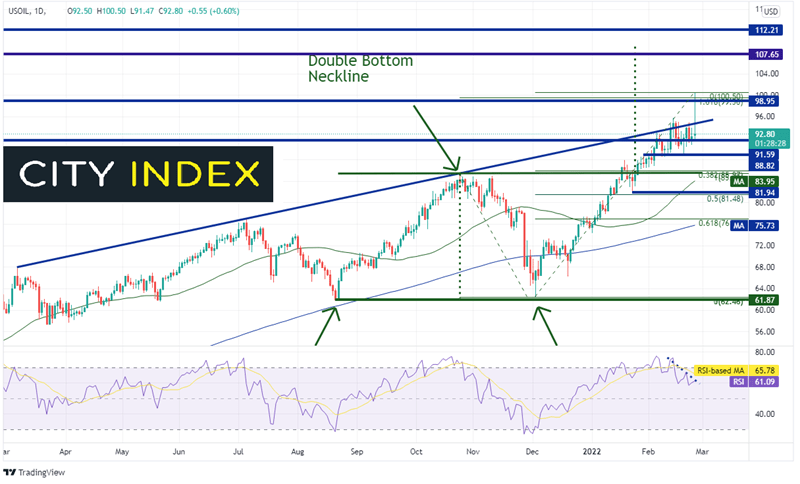
However, just because the price of crude oil may trade lower for a few days, it doesn’t mean that price won’t go higher later. Notice the RSI is diverging with price. This increases the chance of a near-term pullback. However, there is plenty of support below which could cause price to reverse and move higher. The first horizontal support is at the lows from February 18th at 89.04. IF the high is in for the moment, the next support is the 38.2% Fibonacci retracement from the lows of December 2nd, 2021 to the highs from today, near 85.97. This level is just above the breakout level at a double bottom neckline at 85.39. Below there is the 50 Day Moving Average at 83.94.
Source: Tradingveiw, Stone X
Trade WTI Crude Oil now: Login or Open a new account!
• Open an account in the UK
• Open an account in Australia
• Open an account in Singapore
Resistance seems like a great distance away at today’s high of 100.50. Also notice the long-term horizontal resistance and the 161.8% Fibonacci extension from the highs of October 25th, 2021 to the lows of December 2nd, 2021 that is in the area. Above these levels the door is wide open to trade to the highs of June 2014 at 107.65 and then the double bottom target near 109. Above there, price can move to 112.21, which is the highs from August 2013.
Price action on the daily candlestick is a shooting star price formation, which is a reversal pattern. If price does pullback, it doesn’t mean it can’t go higher later, possibly even towards the double bottom target near $109. If oil supply is cut off from Russia, price should move higher. However, keep an eye on the events regarding Iran. If Iran can return to market, the increase in supply could cause prices pull back. Watch the technicals for levels where price may pause or even reverse.
Learn more about oil trading opportunities.
Latest market news
Yesterday 03:30 PM
Yesterday 01:23 PM
Yesterday 11:00 AM
Yesterday 08:15 AM
Latest Trade Ideas articles
Yesterday 11:00 AM
Yesterday 08:15 AM
Yesterday 05:45 AM