


April 14, 2021 12:36 PM
Is USD/CHF trying to tell us something about DXY?
DXY and USD/CHF is known to have a positive correlation, and it’s usually a strong one. As such, when traders don’t have access to the DXY, they sometimes trade USD/CHF as a proxy. Except for a brief dip in late February, the correlation between the 2 assets has been above +0.90 for most of 2021. The current correlation coefficient is +0.93. A correlation coefficient of +1.00 means that the two assets are perfectly correlated and move together on a 1-for-1 basis. A reading of +0.93 is pretty close! USD/CHF hit a key inflection point today at 0.9200 and bounced. This level has acted as both support and resistance many times. Does this mean that the DXY is ready for a bounce as well?
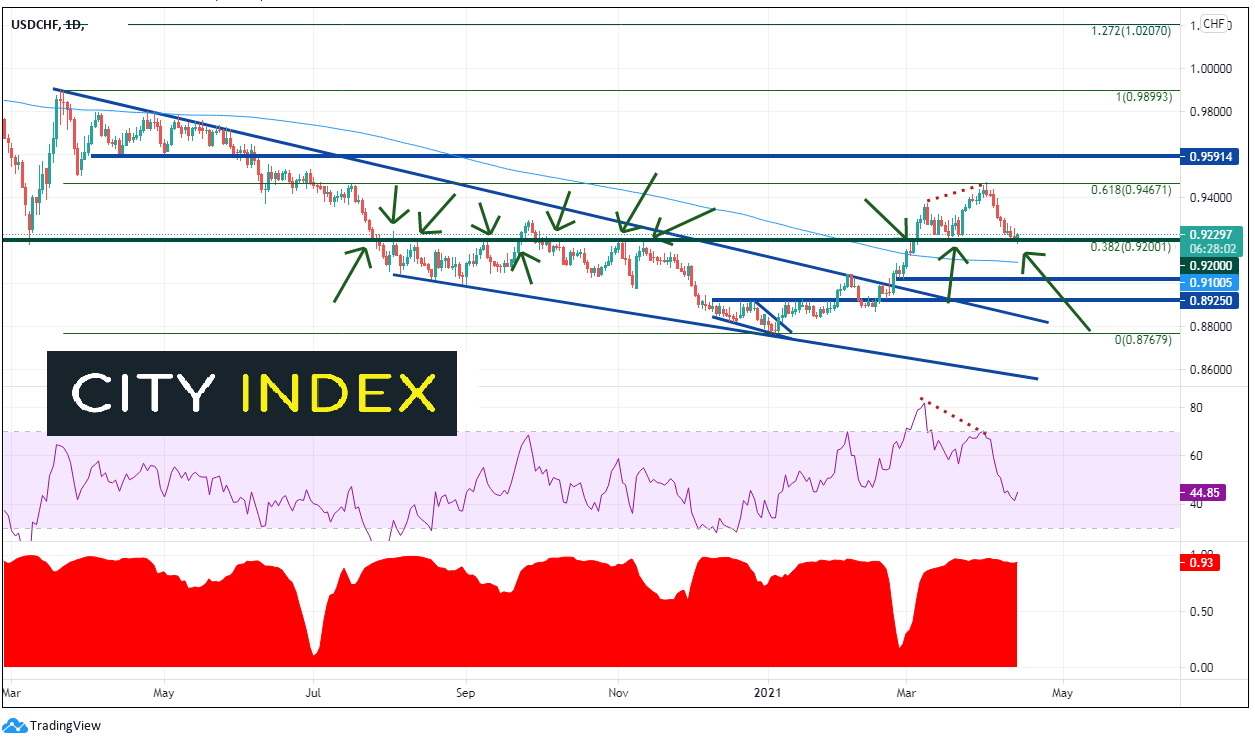
Source: Tradingview, City Index
USD/CHF had been trading in a descending wedge from March 2020 until late February 2021. The pair broke higher above the top downward sloping trendline on February 23rd. The target for the breakout of a descending wedge is a 100% retracement of the wedge. The pair moved aggressively towards the target, crossing through the 200 Day Moving Average and the key 0.9200 level along the way. USD/CHF stalled on April 1st at the 61.8% Fibonacci retracement level from the March 23rd, 2020 highs to the January 6th lows, near 0.9467. At the time, the RSI was above 80 and diverging with price. USD/CHF has corrected since then and, today, put in a low on 0.9187 and bounced back above 0.9200. This level is also the 38.2% Fibonacci retracement from the lows of February 23rd to the highs on April 1st. Support is at the 92.00 level (or todays lows at 0.9187) and then the 200 Day Moving Average near 0.9100. Resistance is at yesterday’s highs near 0.9259. If price breaks above, it can run back towards the April 1st highs at 0.9467!
The price action in the DXY has been similar to that of USD/CHF. DXY had been moving lower since March 2020 as well. The US Dollar Index began moving higher on February 25th (2 days after USD/CHF bottomed) and stalled on its way toward a descending wedge target, putting in a high on March 31st (1 day prior to USD/CHF). However, as DXY pulled back, it took out horizontal support AND the 38.2% Fibonacci retracement from the February lows to the March 31st highs (whereas USD/CHF did not). Support is now at the 50% Fibonacci retracement level from the same timeframe near 91.57, and then the March 18th lows and horizontal resistance near 91.30. Horizontal resistance is at yesterday’s high and the 200 Day Moving Average near 92.26.
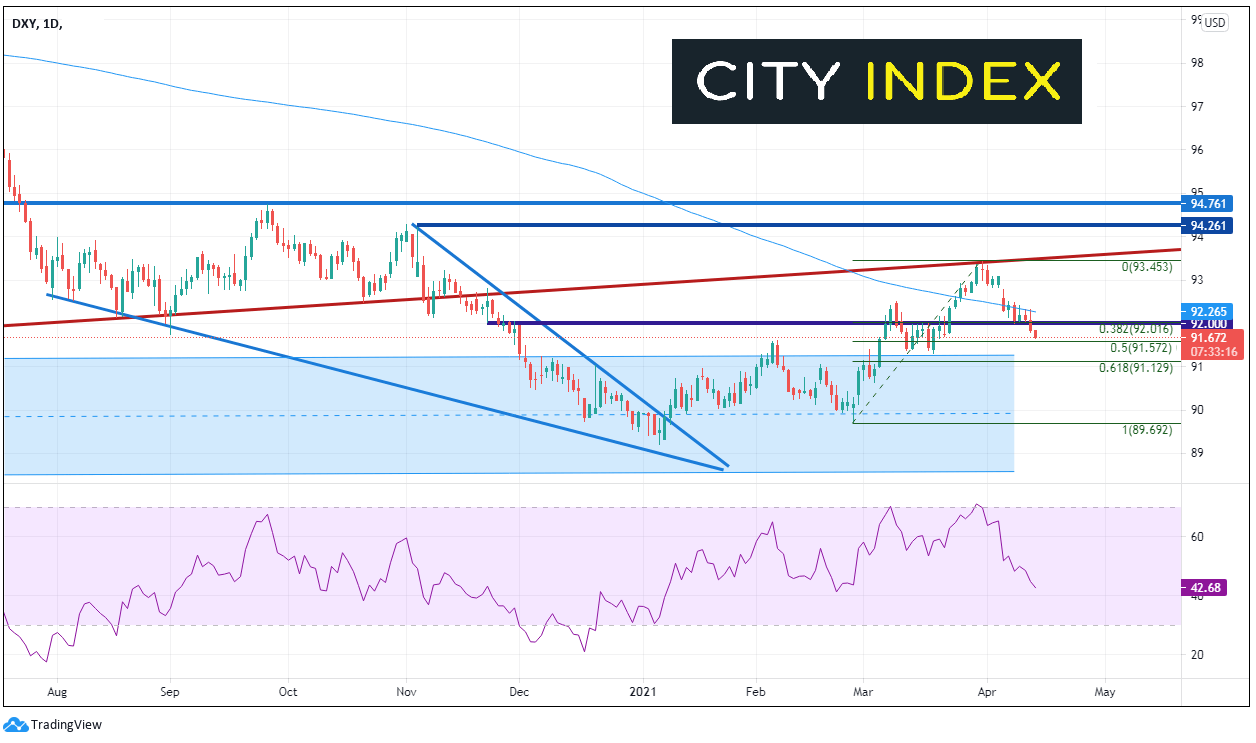
Source: Tradingview, City Index
The DXY has moved lower relative to USD/CHF since April 1st and is approaching support at the previously mentioned 50% retracement level. USD/CHF tested support today and bounced. If the 2 assets are truly, positively correlated, one may expect that the DXY will bounce soon as well.
Learn more about forex trading opportunities
Latest market news
Today 08:28 AM
Yesterday 03:30 PM
Yesterday 01:23 PM
Yesterday 11:00 AM
Yesterday 08:15 AM
Latest DXY articles
April 23, 2024 11:01 PM
April 23, 2024 04:19 AM
April 10, 2024 11:24 PM
April 8, 2024 03:35 AM