Investors say one thing but do another two charts to watch
Financial markets are in reflective mood as we start a new week, there seems to be a willingness to recalibrate the Trump trade, however no […]
Financial markets are in reflective mood as we start a new week, there seems to be a willingness to recalibrate the Trump trade, however no […]
Financial markets are in reflective mood as we start a new week, there seems to be a willingness to recalibrate the Trump trade, however no one seems ready to press the sell button. Likewise, there is anticipation that US Treasury yields will rise especially now that the Fed is hiking interest rates and talking about shrinking its balance sheet, however the 10-year yield is still below 2.4%. Investor sentiment is also starting to nose-dive, however, traders aren’t willing to put their money where their mouths are.
The two charts below highlight the dichotomy that is at play in the markets right now. On the one hand there is a smell of caution in the air, but on the other, capital is not yet moving away from risky assets. The first chart below is the Credit Suisse fear barometer, which measures investor sentiment for a 3-month horizon. This has reached its highest level since November 2016, as US – Russian fears boil over, French election and Brexit risks bite and people worry about the Fed tightening monetary policy. These fears may keep investors up at night with worry, but it is not impacting where they put their money, as chart 2 shows.
The second chart shows the Barclays US Corporate high yield debt – 10-year US Treasury spread, which remains close to its lowest level since 2014, and is looking remarkably stable. This spread, which measures the cost of capital for higher risk US corporates vs. the United States Government, usually spikes when risk aversion rises. The fact that it has barely moved even though risk indices have picked up, can tell us a few things about where asset prices may go in the coming weeks.
What this dichotomy tells us:
Chart 1: Credit Suisse Risk Barometer
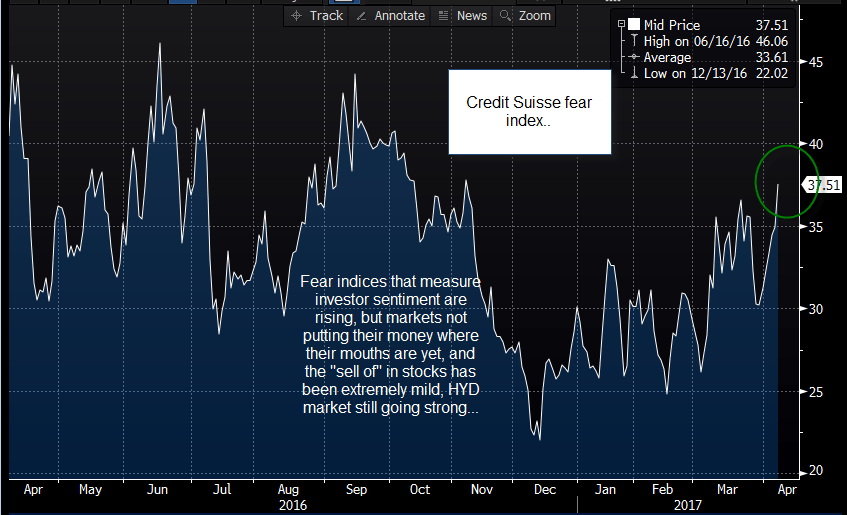
Source: Bloomberg and City Index
Figure 2:
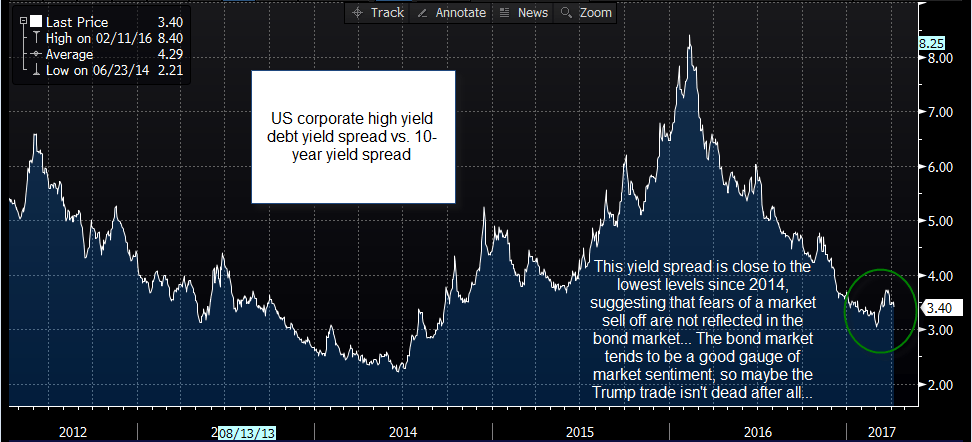
Source: Bloomberg and City Index