


Since bottoming just over a month ago, major US indices have staged a furious bounce to their highest levels since September. Surprisingly for some traders, this rally has been led by the stodgy Dow Jones Industrial Average (+19% trough-to-peak rally), rather than the broader S&P 500 (+15%) or the previously high-flying Nasdaq 100 index of technology stocks (+14%).
As the chart below shows, the DJIA (US 30) has spent this week coiling just below key resistance around 34,000. After a big rally into resistance, this week’s tight range signals a fine balance between buyers and sellers, but the short-term momentum still remains with the bulls, so if prices can break and close conclusively above 34,000, a bullish continuation toward the March/April highs in the mid-35,000s may be next.
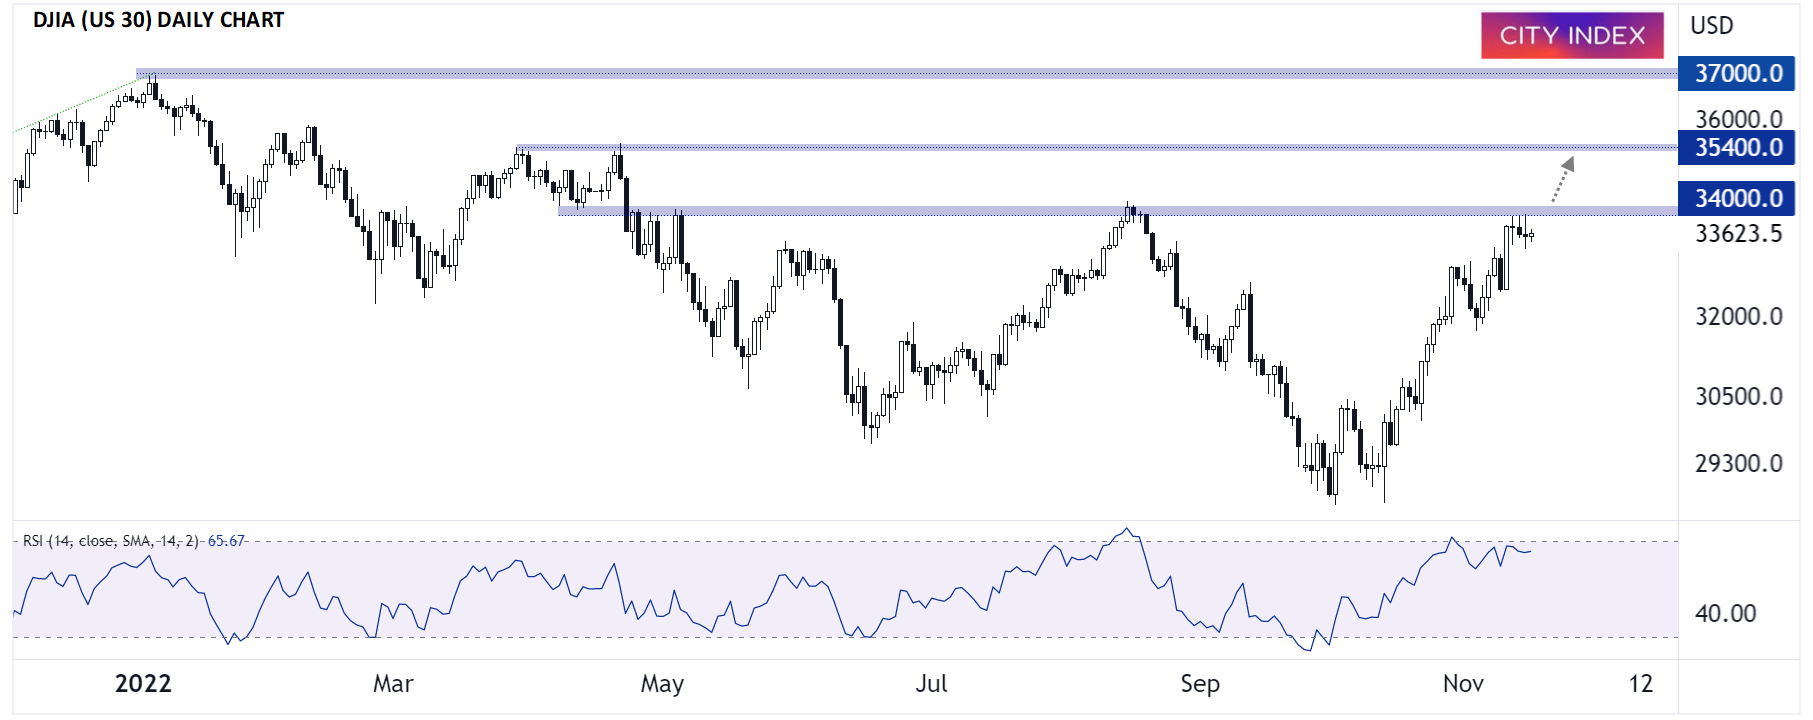
Source: TradingView, StoneX
In terms of fundamental catalysts, we’re nearing the end of a mediocre-but-still-better-than-expected Q3 earnings season for US stocks, so traders are likely to shift their focus to macroeconomic data heading into the holidays. Specifically, the more timely, on-the-ground style of reports – including the regional Fed indices and PMI readings – will be worth watching for early signs that the US economy may be heading into a recession. Of course, the top-tier reports for the rest of the year will be inflation data (CPI and Core PCE), as well as the Fed’s hotly-anticipated monetary policy meeting in mid-December.
After months of “bad (economic) news is good news (for the stock market),” we may be nearing an inflection point as we approach peak Fed Funds rates around 5%. Now, instead of worrying what economic data may mean for the Fed, which appears set to gradually slow rate hikes over the next few months, traders will key in on what it means for underlying US economy and the potential for a recession in 2023.
In that vein, DJIA bulls would prefer to see strong economic data to support a continued rally to 35,000 or beyond in the index.
How to trade with City Index
You can trade with City Index by following these four easy steps:
-
Open an account, or log in if you’re already a customer
• Open an account in the UK
• Open an account in Australia
• Open an account in Singapore
- Search for the market you want to trade in our award-winning platform
- Choose your position and size, and your stop and limit levels
- Place the trade
Latest market news
Today 11:14 AM
Today 08:28 AM
Yesterday 03:30 PM
Latest Dow Jones articles
April 15, 2024 01:14 PM
April 15, 2024 06:08 AM
April 9, 2024 01:15 PM