


View related analysis: Yes, inflation may have peaked but it “remains far too high”
- Implied volatility for CAD/JPY has increased for the next week and month, according to ATM (at the money) options.
- 2 and 10-year yield differentials between CA and Japan’s bond yields are moving higher, which can be supportive of a currency.
- Oil prices have broken out of a base, which can also be supportive for CAD.
- BOC could hike 50bp in September, and another 50bp by the year end.
Like many developed economy’s, Canada is showing signs that annualised inflation has peaked yet remains historically high. This is forcing the BOC (Bank of Canada) to continue hiking interest rates (to the detriment of growth as they try to tame higher prices without heading towards a recession. And whilst inflation data softened recently, the BOC immediately warned that it “remains far too high” - which is effectively a green light for further hikes. But as we noted in the previous report, two of the three preferred CPI reads for the BOC moved higher anyway, so perhaps there are more hikes that money markets are currently anticipating.
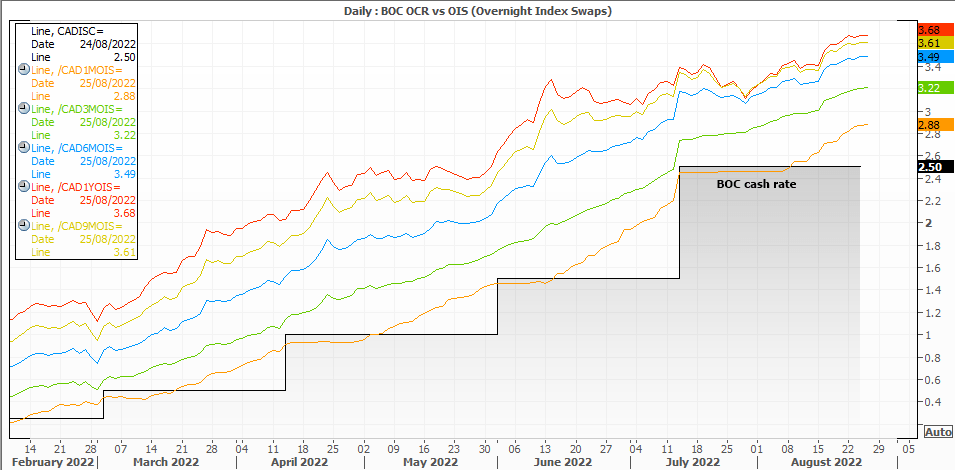
Odds slightly favour a 50bp hike at the BOC’s next meeting
As it stands, Scotia Bank expect interest rates to peak at 3.5% which leaves another of hikes on the table. The 6-month OIS has fully priced this in by February, and there are three meetings left this year. A 25-bp hike in September is more than priced and money markets currently estimate a ~52% chance of a 50bp hike at their next meeting. And that’s not going to help lift business sentiment as the grapple with high inflation and the higher cost of money.
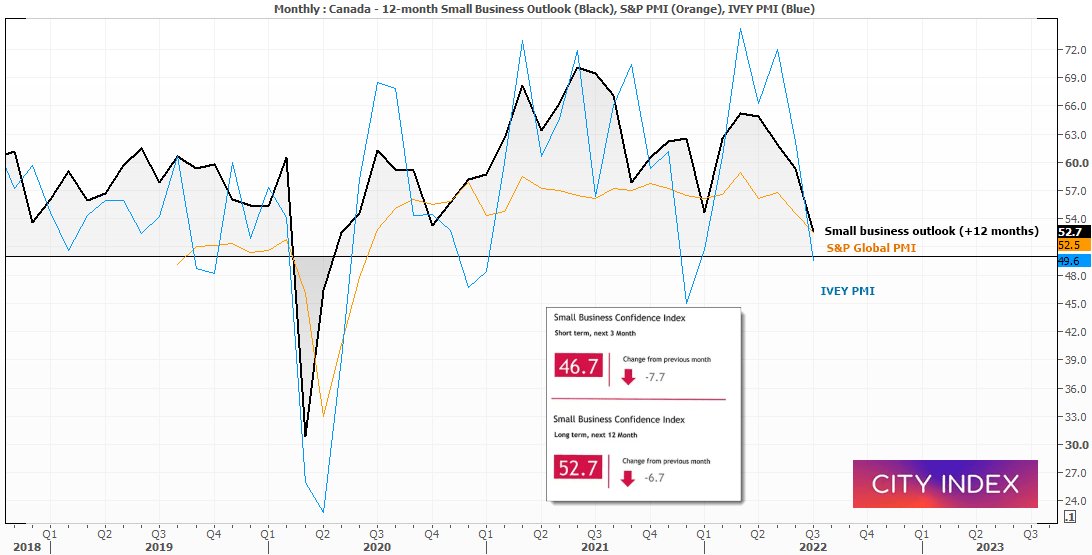
Small businesses have a grim outlook for Canada’s economy
Canada’s 3-month small business outlook contracted in July, and the Ivey and S&P Global PMI’s are close to joining it as they head south. Looking through the Ivey PMI report shows that supply chains and high prices remain the key issues for Canada purchase managers. Yet whilst the BOC hike to tame higher prices, it will not fix slow delivery time or help clear excess inventories.
The 1-year small business outlook is also tracking PMI’s towards contraction at a faster pace, and this is something the BOC will have to consider as they keep hiking rates. It will not be enough to derail the BOC’s next hike – and that could help the Canadian dollar rise further. And we note that some correlated markets are hinting that the CAD may have further to climb.
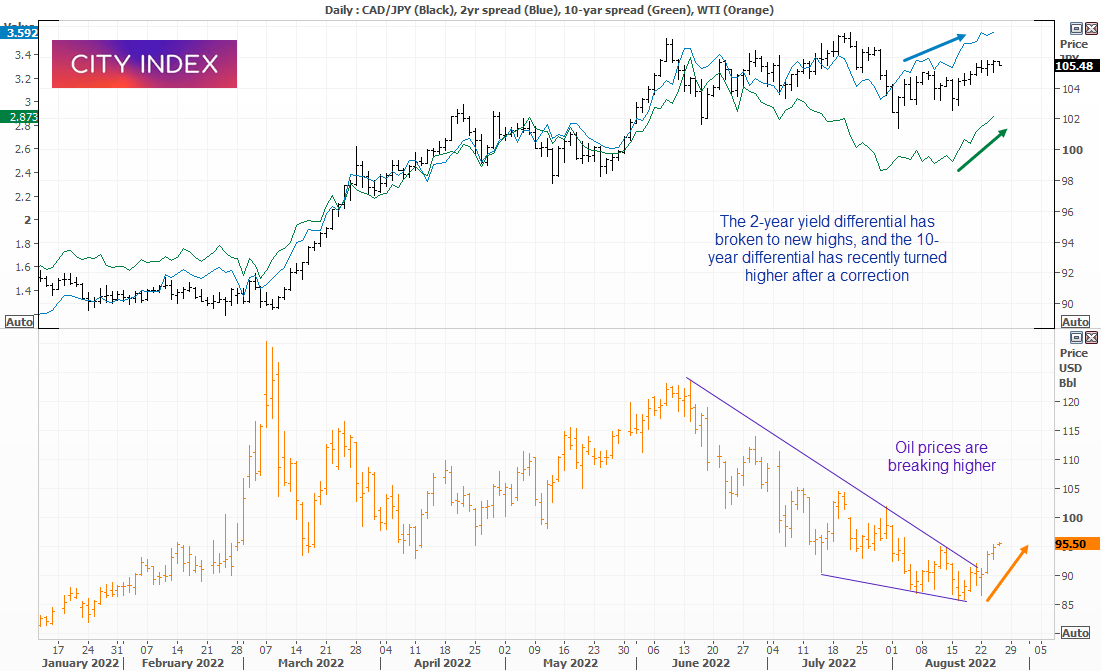
Correlated markets suggest a bullish move for CAD/JPY
Integrating correlations alongside a chosen market can help provide a fuller picture of the potential drivers behind a chosen market. In this instance, we note that oil prices have broken higher from a bearish trendline and confirmed a bullish wedge pattern – and as oil is a key commodity for Canada it can benefit the currency. Assuming WTI reaches the wedge target it may rise to the $105 area – and potentially help CAD/JPY break to a new high.
Yield differentials are also supportive of a higher CAD/JPY. The 2-year differential (Canada yield – Japan yield) remains in a strong uptrend and has reached a new cycle higher overnight. As traders tend to focus on the 2-year yield as a better indication of economic policy, it suggests hawkish expectations for the BOC (Bank of Canada) remain in place.
The 10-year CA-JP yield differential has also turned higher after a retracement, to suggest momentum has realigned with its longer-term uptrend, and is also a potential driver for a higher CAD/JPY.
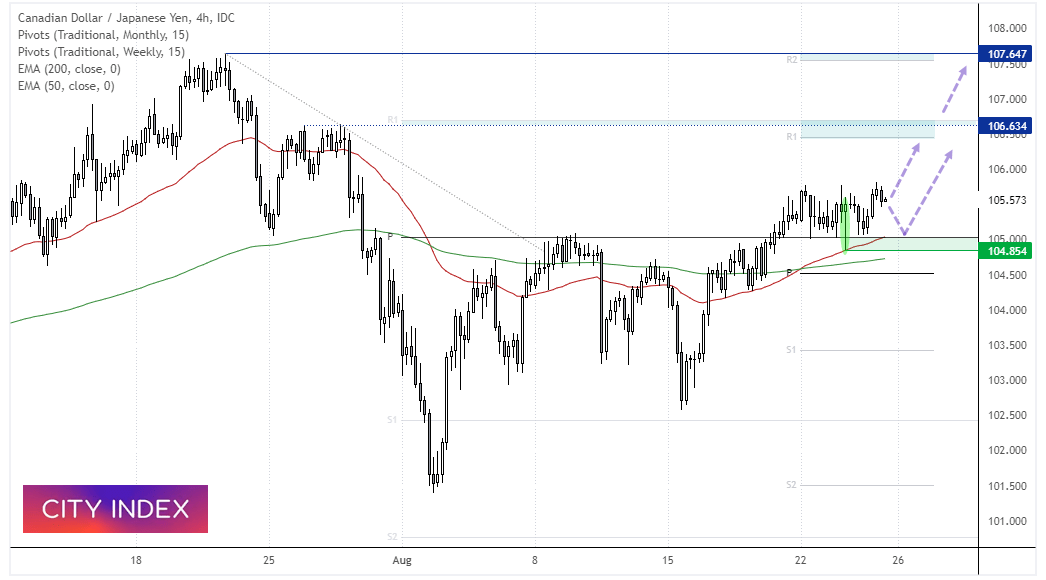
CAD/JPY 4-hour chart
In yesterday’s European Open we outlined a case for the yen to rise heading into the Jackson Hole Symposium, and highlighted NZD/JPY as a potential short if it breaks below 84.38. But until it does, it remains a candidate for range trade ideas.
CAD/JPY is the preferred bullish looing at its price action. We can see on the 4-hour chart that it now trades above its 200 and 50-bar eMA’s and weekly pivot point. A bullish hammer confirmed the 50-bar eMA as support, and prices are now holding above the monthly pivot point during a sideways consolidation.
Resistance zones around 106.50 and 107.50 make potential targets for bulls, so we’re either looking for a direct break higher, or evidence of a swing low above the 105 area. A break below 104.85 invalidates the bullish bias.
How to trade with City Index
You can easily trade with City Index by using these four easy steps:
-
Open an account, or log in if you’re already a customer
• Open an account in the UK
• Open an account in Australia
• Open an account in Singapore
- Search for the company you want to trade in our award-winning platform
- Choose your position and size, and your stop and limit levels
- Place the trade
Latest market news
Yesterday 08:33 AM
Latest Technical Analysis articles
April 15, 2024 07:13 PM
April 14, 2024 11:37 PM
April 13, 2024 08:00 PM
April 12, 2024 04:51 AM