Gold Will the rally cross 1100
Right as gold bears were doing victory laps, everyone’s favorite yellow metal has staged a big comeback over the last two days. Gold ticked down […]
Right as gold bears were doing victory laps, everyone’s favorite yellow metal has staged a big comeback over the last two days. Gold ticked down […]
Right as gold bears were doing victory laps, everyone’s favorite yellow metal has staged a big comeback over the last two days. Gold ticked down to a low of 1046 ahead of yesterday’s big ECB meeting, but Draghi’s failure to deliver lead to a massive 400+ pip rally in EUR/USD. The combination of easier monetary policy in the Eurozone and US dollar weakness collaborated to drive gold up about 20 points. That move stretched into today’s trade as bears continued to abandon the crowded trade en masse, and the metal is trading another 20 points higher at 1085 as we go to press.
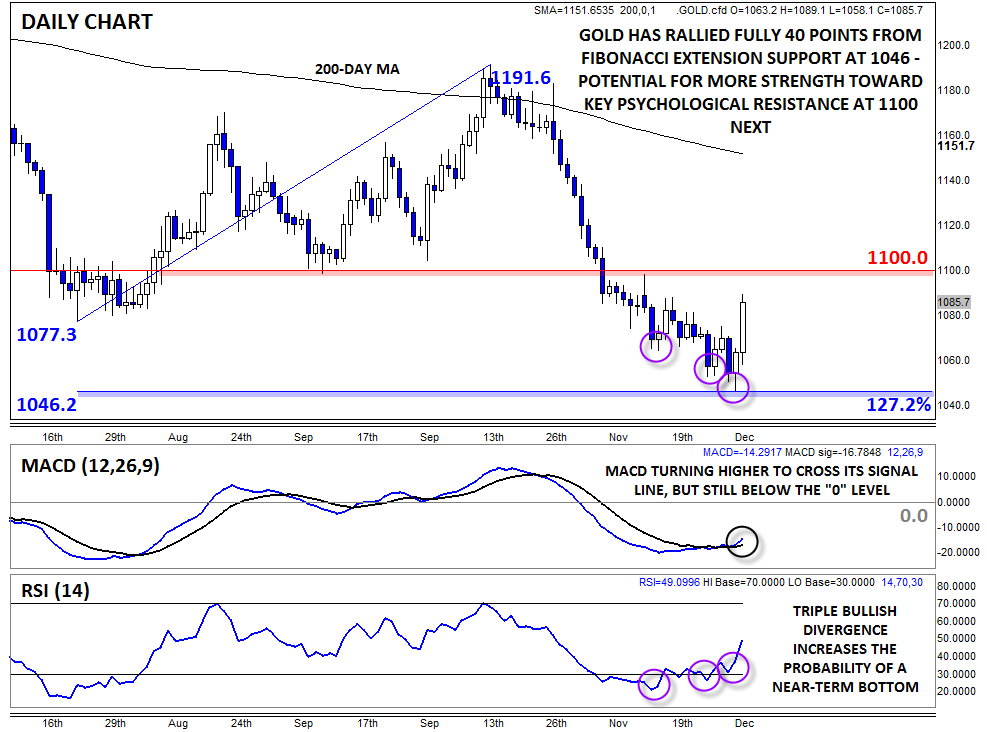
While the move so far could easily be chalked up to a short-term oversold bounce, there is a case to be made that the rally could carry over into next week. For one, yesterday’s daily chart formed a clear Piercing Candle* pattern off the 127.2% Fibonacci extension of the July-October rally at 1046; for the uninitiated, this pattern shows a shift from buying to selling pressure and is often seen at near-term bottoms in the market.
Meanwhile, the secondary indicators are also showing positive signs for the first time in several weeks. The MACD is turning higher and has now crossed above its signal line, showing fading bearish momentum. Perhaps more importantly, the RSI indicator formed a prominent triple bullish divergence with price over the last few weeks (the RSI put in three higher lows while gold itself put in three lower lows), once again signaling clearly fading bearish momentum.
The big test for the gold rally (if it’s reached) will be the 1100 level. In addition to being an important psychological level, 1100 was also a major previous support level from back in September that could provide resistance moving forward. A break above that level could open the door for a reversion back toward the 200-day MA around 1145-50, whereas a rejection at the 1100 would leave bears with the upper hand over the medium-term horizon.
*A Piercing Candle is formed when a candle trades below the previous candle’s low, but buyers step in and push rates up to close in the upper half of the previous candle’s range. It suggests a potential bullish trend reversal.